4,196 STB/d
Find the missing barrels
The gap between actual production and technical potential, 8.3% of potential on the demo field, worth $87.31M a year before a single well is touched.
Production Value Intelligence · v2.0
PETROVALUE OPX measures the gap between what every well makes and what it could make, explains the engineering cause, and turns it into ranked, costed interventions that a named engineer approves — then checks whether the value was actually recovered.
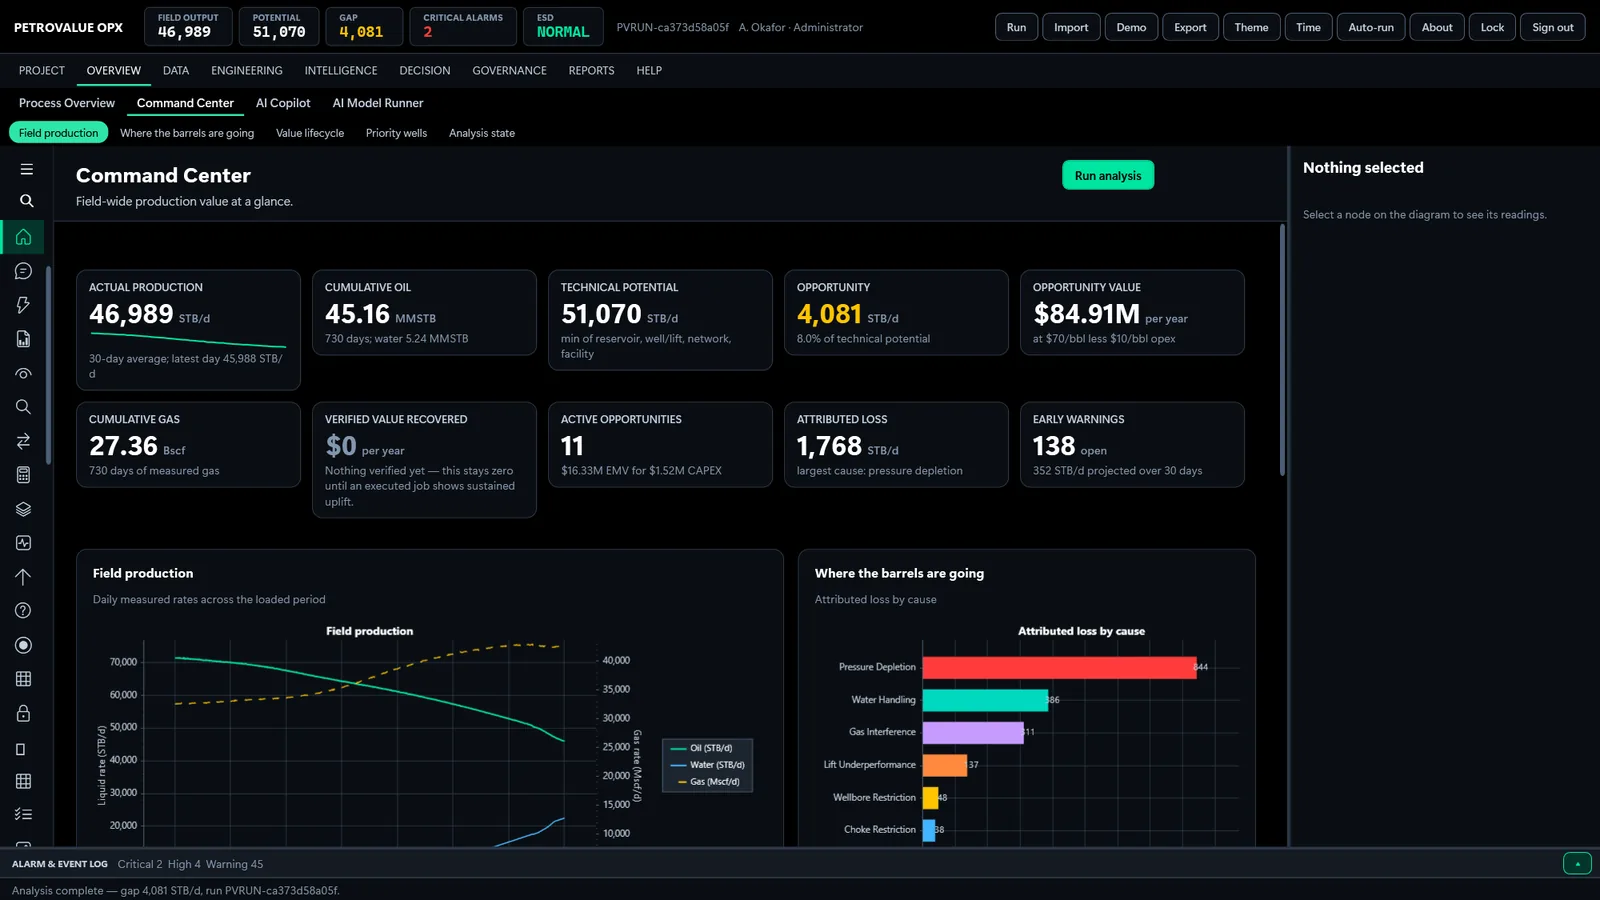
What it's worth to your asset
Most producing fields run below what their wells, network and plant could deliver. PETROVALUE measures that gap well by well, prices it, and turns it into an approved, costed work programme. The figures below are what it finds on its built-in 50-well demo field.
4,196 STB/d
The gap between actual production and technical potential, 8.3% of potential on the demo field, worth $87.31M a year before a single well is touched.
$31.56M EMV
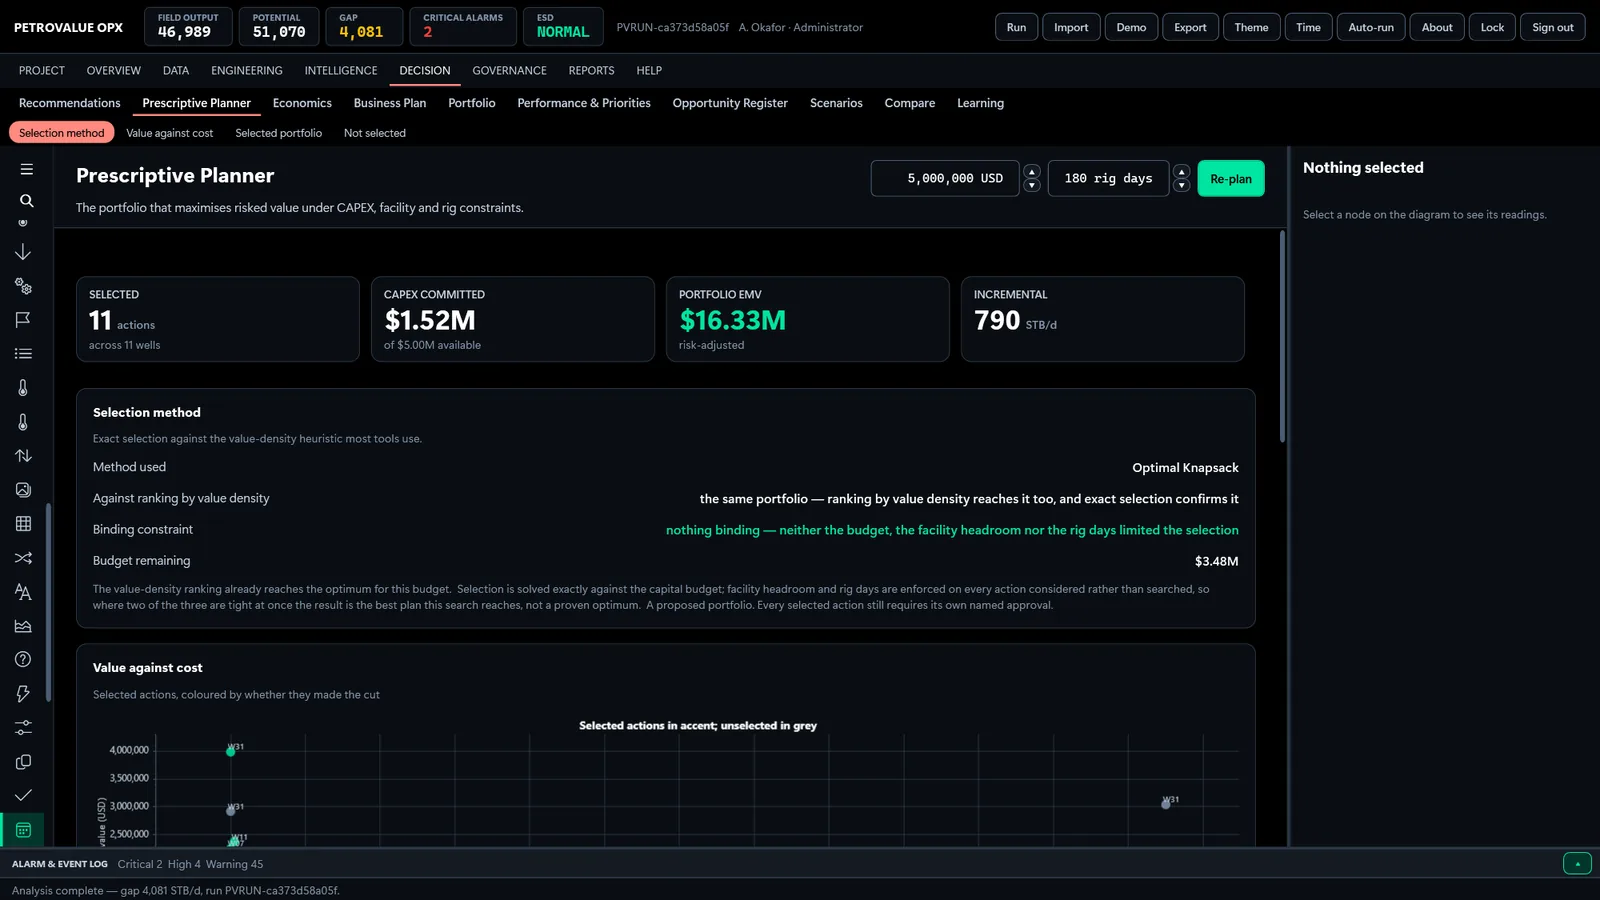
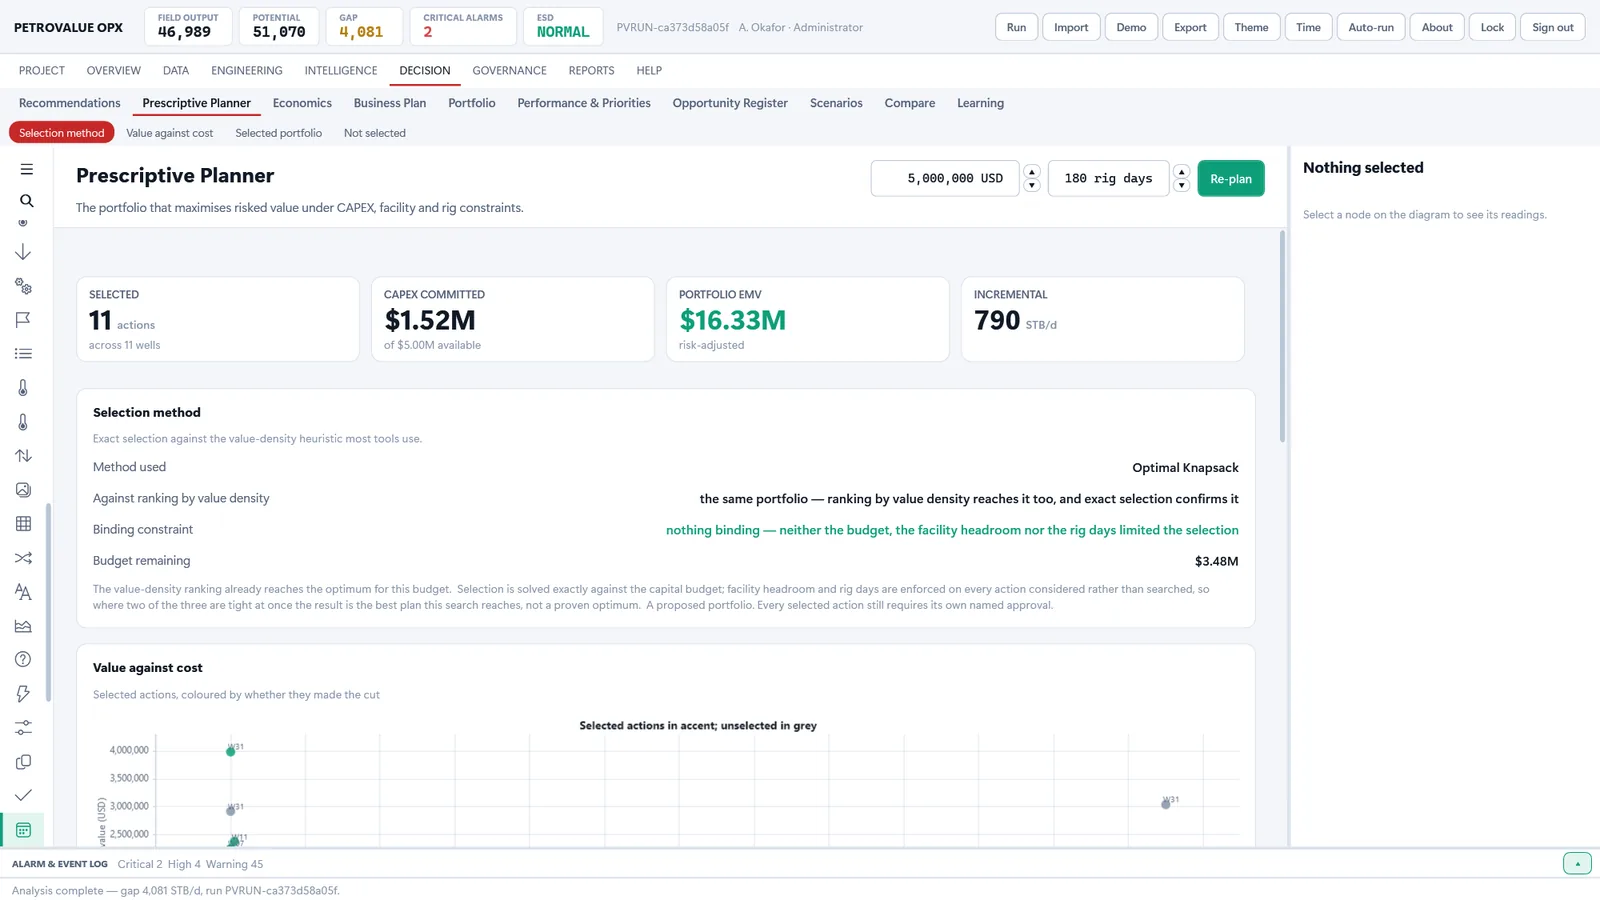
A portfolio of 10 interventions for $1.17M of CAPEX, solved exactly against the capital budget and held inside the plant headroom and the rig days. On this field a value-density ranking reaches the same portfolio — and the planner says so on screen, rather than asking you to take the harder method on trust.
2,365 / 2,365
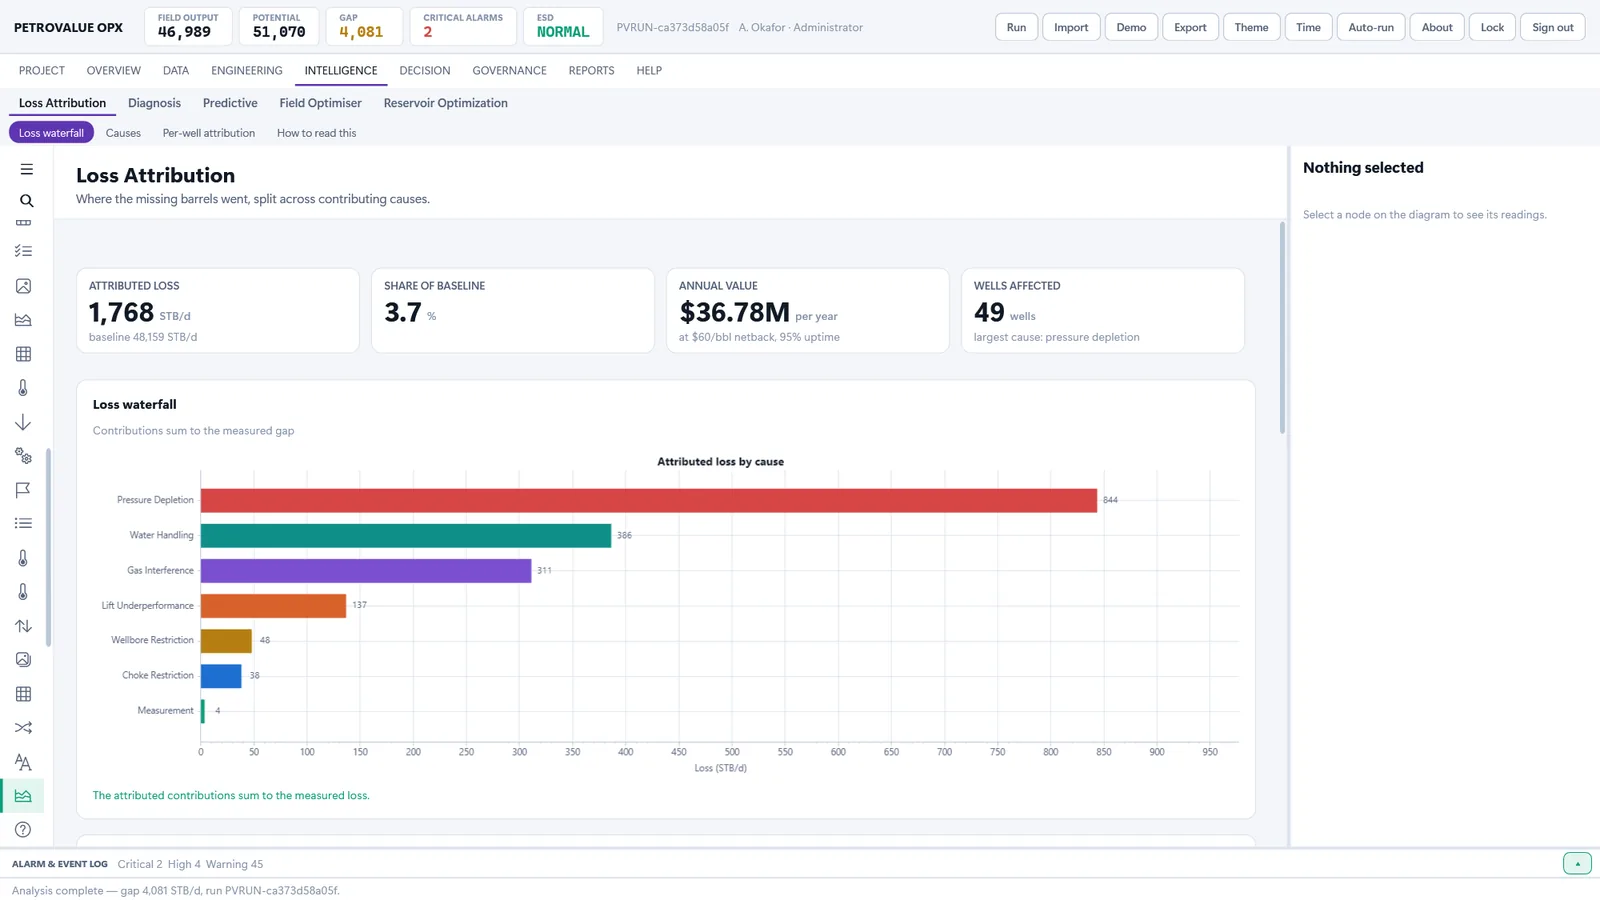
On ninety-six fields held out from tuning it names all 2,365 planted faults and accuses none of 1,475 healthy wells. Every lost barrel is attributed to its causes, so the waterfall adds up to the measured loss.
70 s
A thousand wells and 730,000 daily records, with a nodal solve for every well and a gas-lift plan that respects the plant, in about seventy seconds on a laptop. The review that used to be a quarterly project runs whenever the data changes.
$0 until proven
Verified Value Recovered stays at zero until an executed job shows a sustained uplift. Outcomes feed back into success probabilities, so the next ranking learns from your field.
100% on-premise by default
Runs offline on Windows, with no cloud upload and no data leaving your machines. Add SQL Server when a whole team needs to share one record. The one optional exception is the AI Agents workspace, which needs an internet connection and your own cloud account.
Opportunity calculator
Enter your field's numbers. The estimate uses the same arithmetic as the Command Center (gap × netback × 365 × uptime), which gives $87.31M a year for the demo field's 8.3% gap. Your real gap comes from your own data.
From signal to verified value
Each step feeds the next, and every figure carries the evidence that produced it. The only number the product counts as success is the last one.
Anchor each well's model to its measured operating point, then compute technical potential against reservoir, well, network and facility limits.
Name the most likely cause per well, with its confidence over competing hypotheses and the measurement that would confirm it.
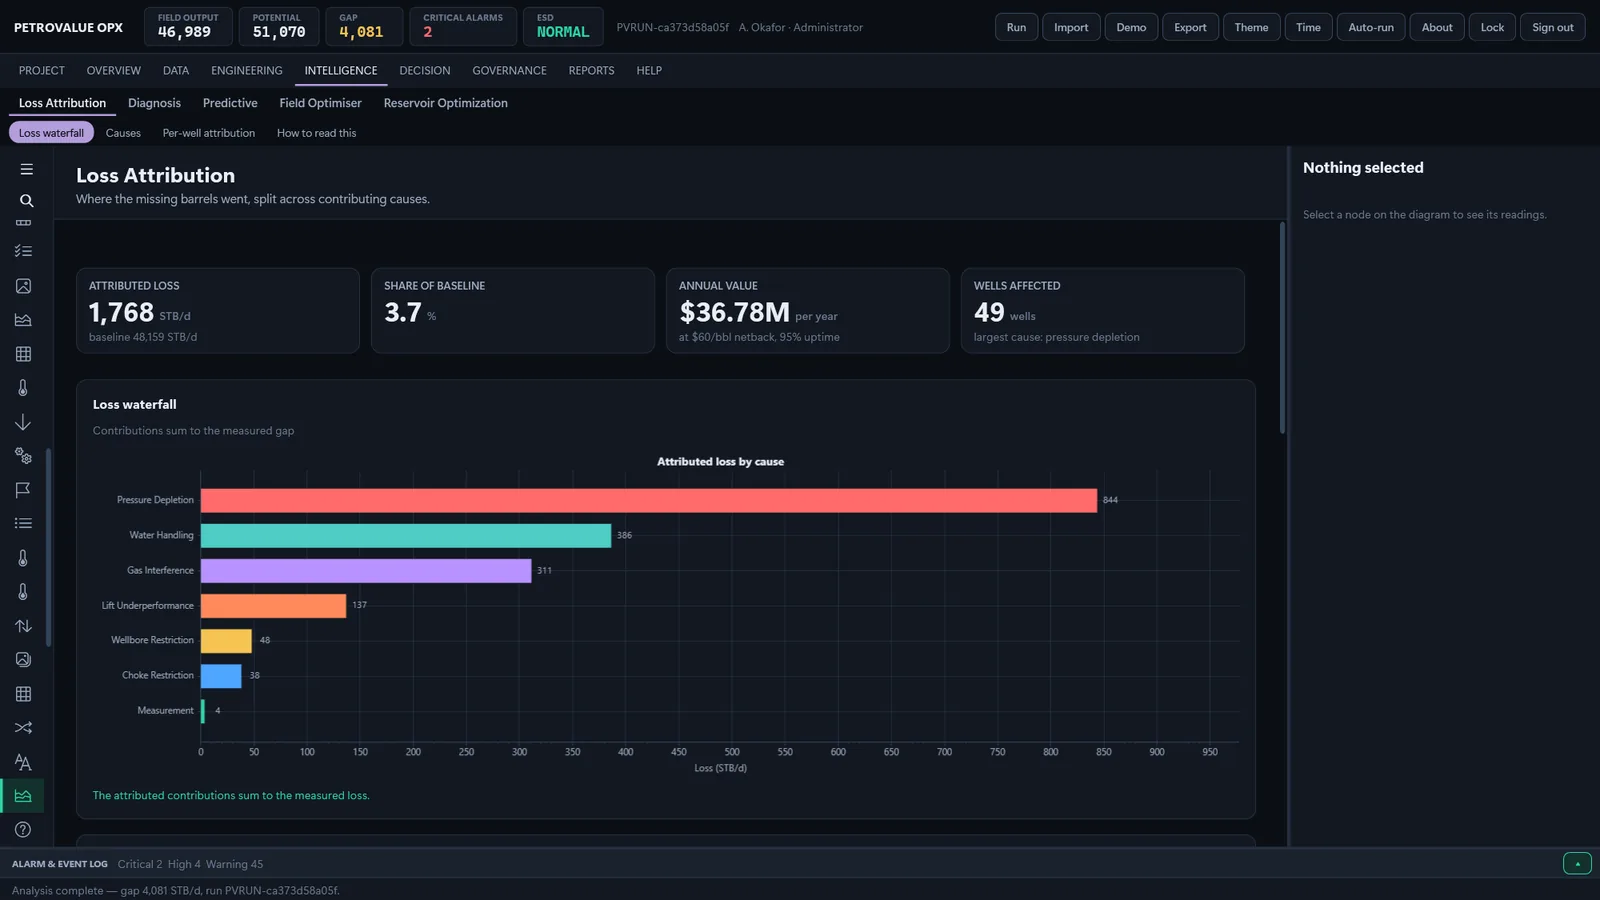
Share the loss across every contributing cause so the waterfall reconciles to the measured gap.
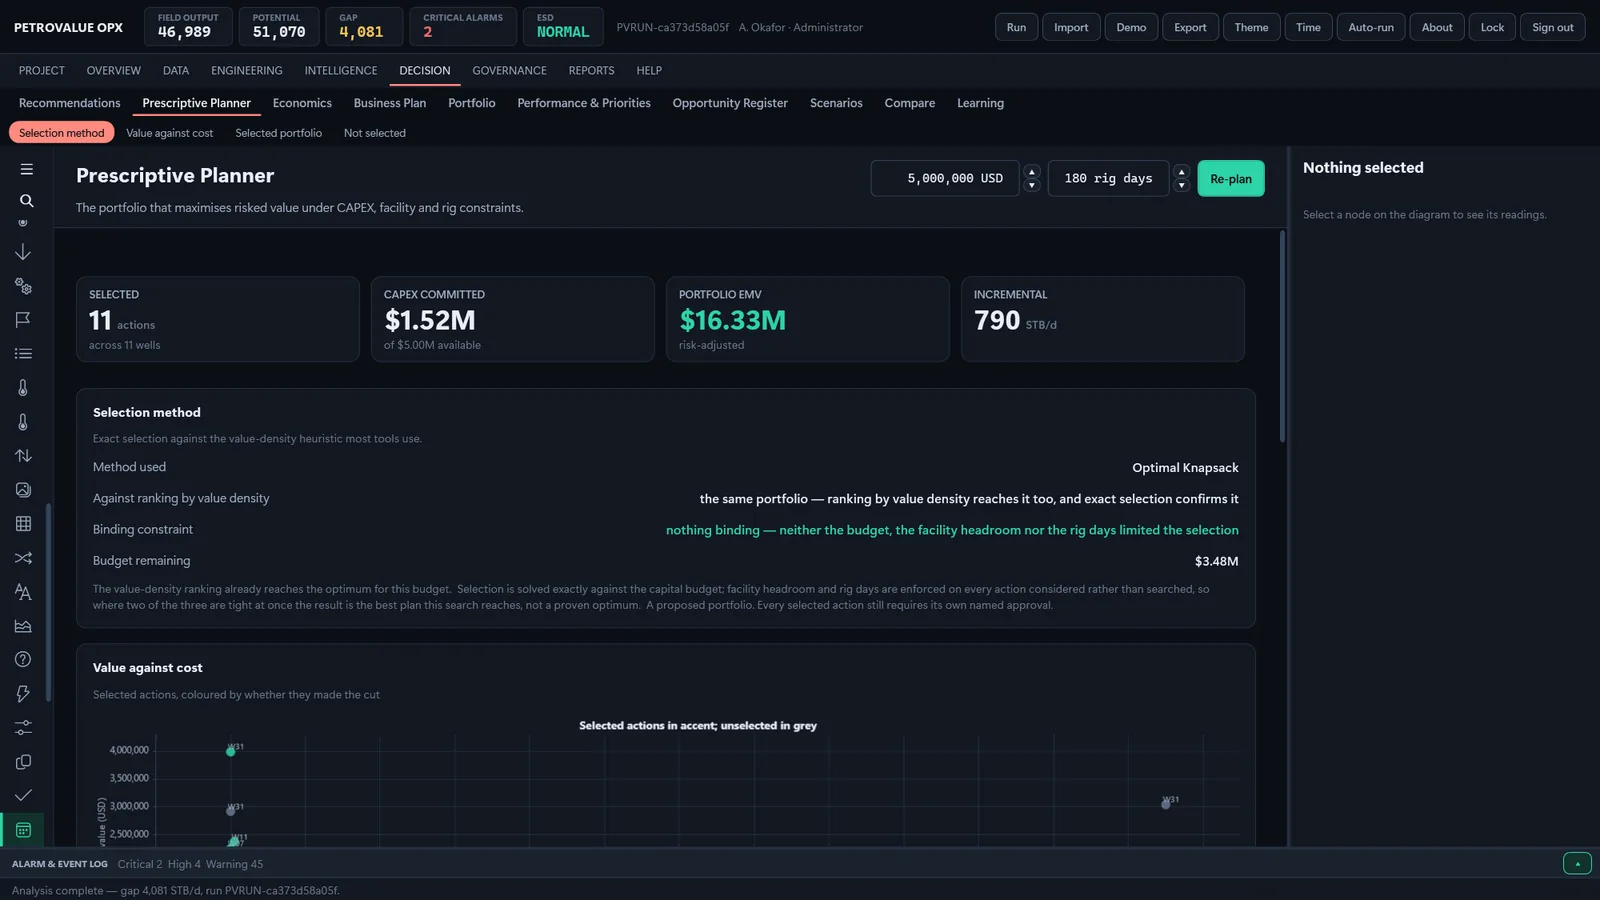
Turn diagnoses into actions with a success probability, a cost and a required approver; solve for the portfolio that fits the capital budget, the plant headroom and the rig days.
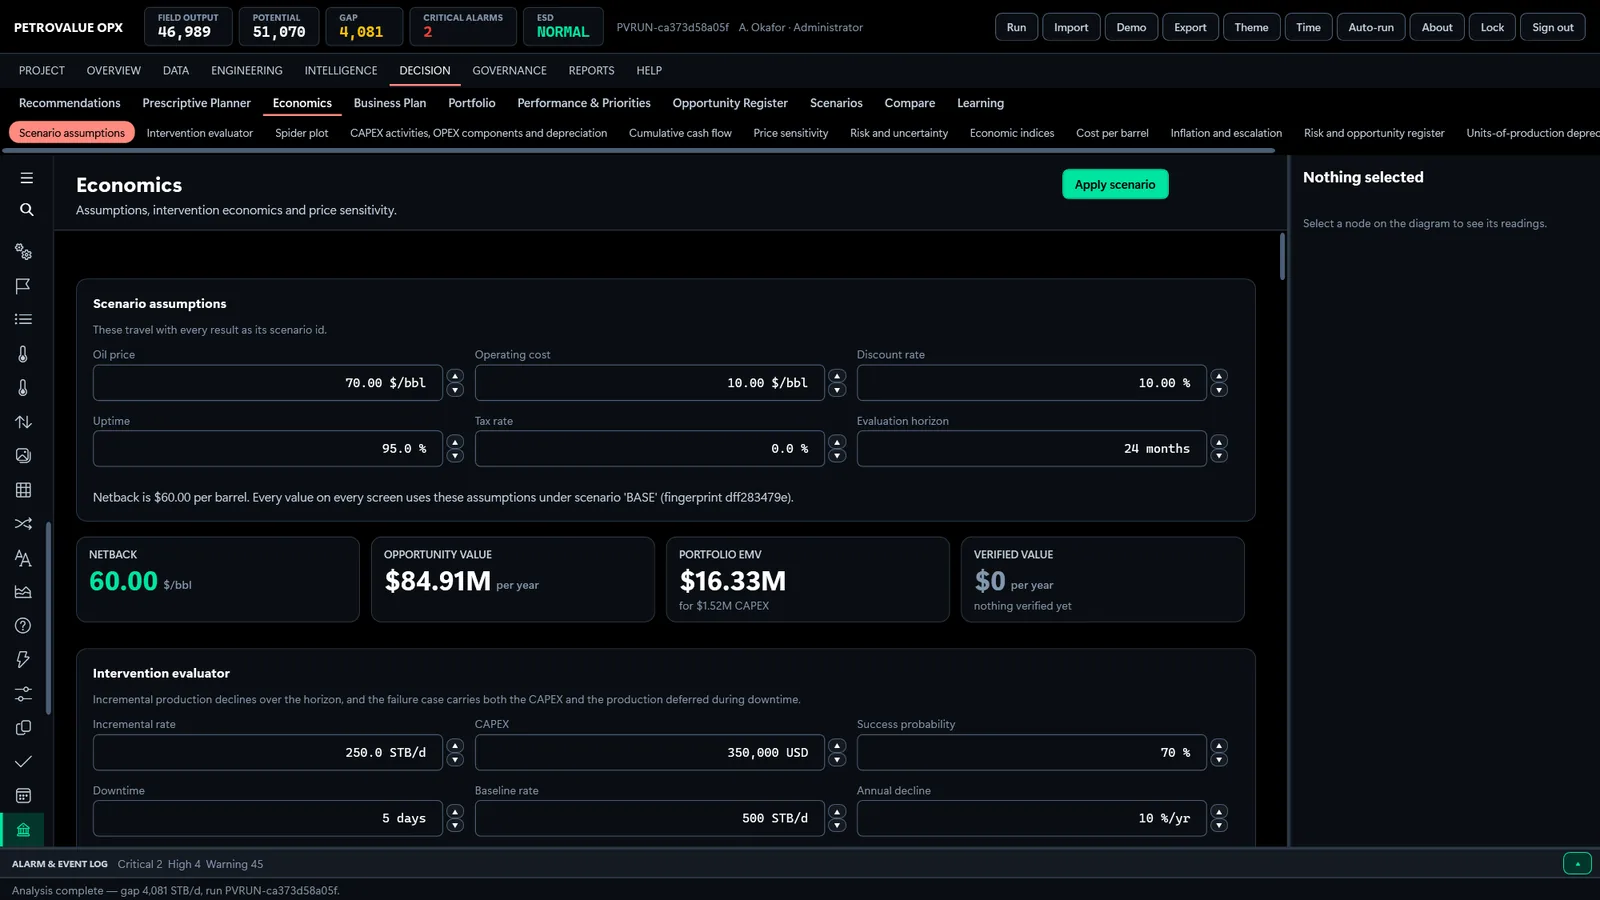
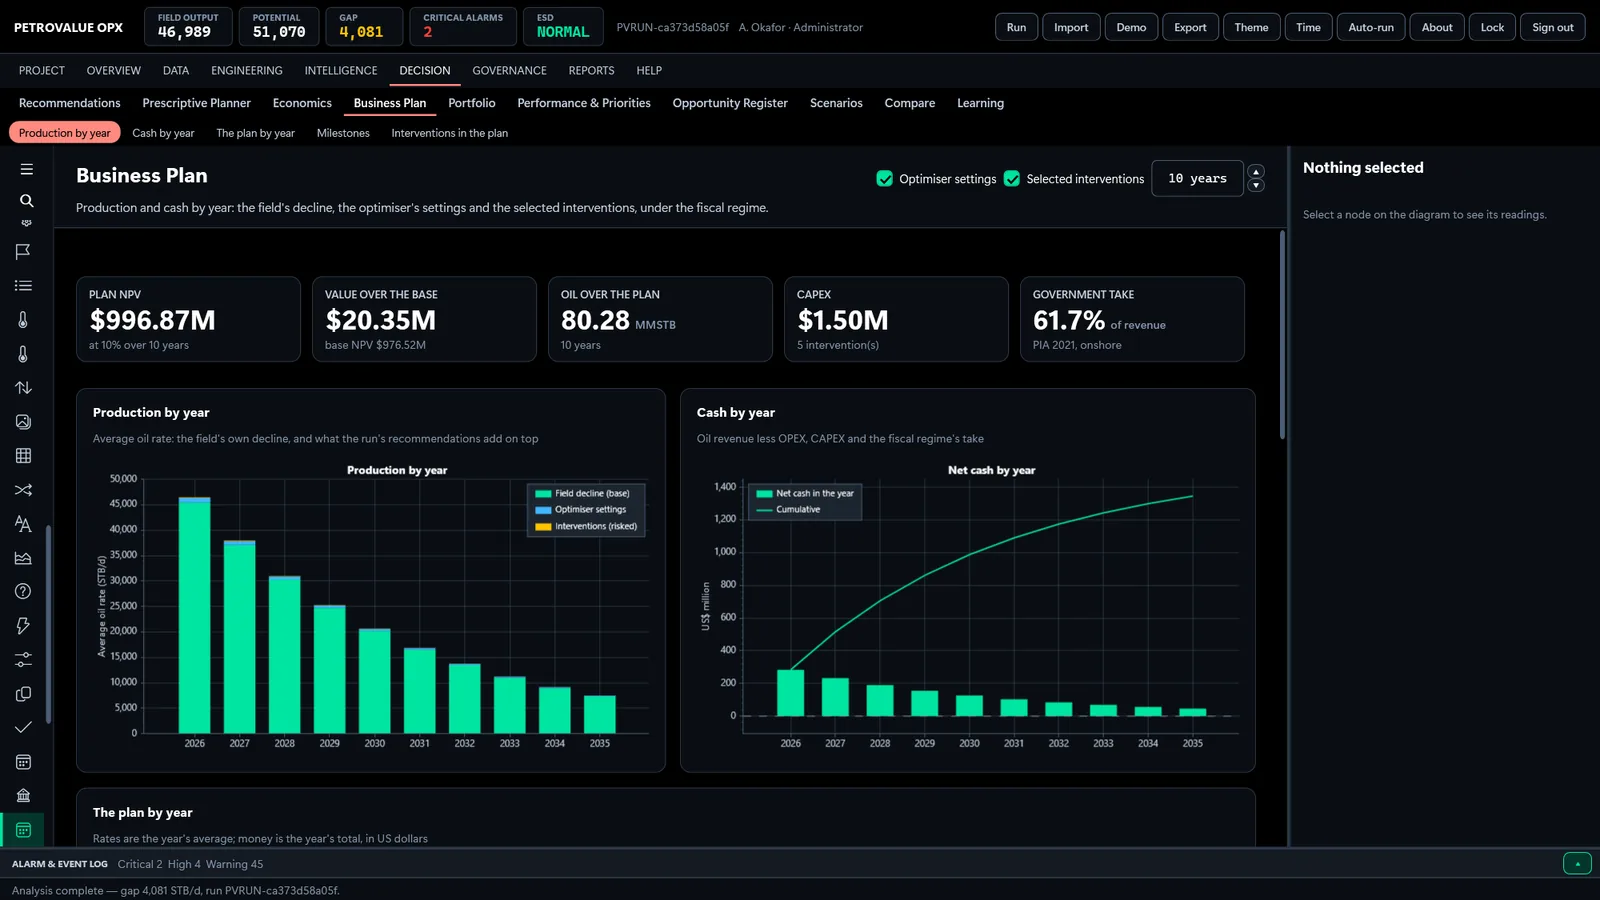
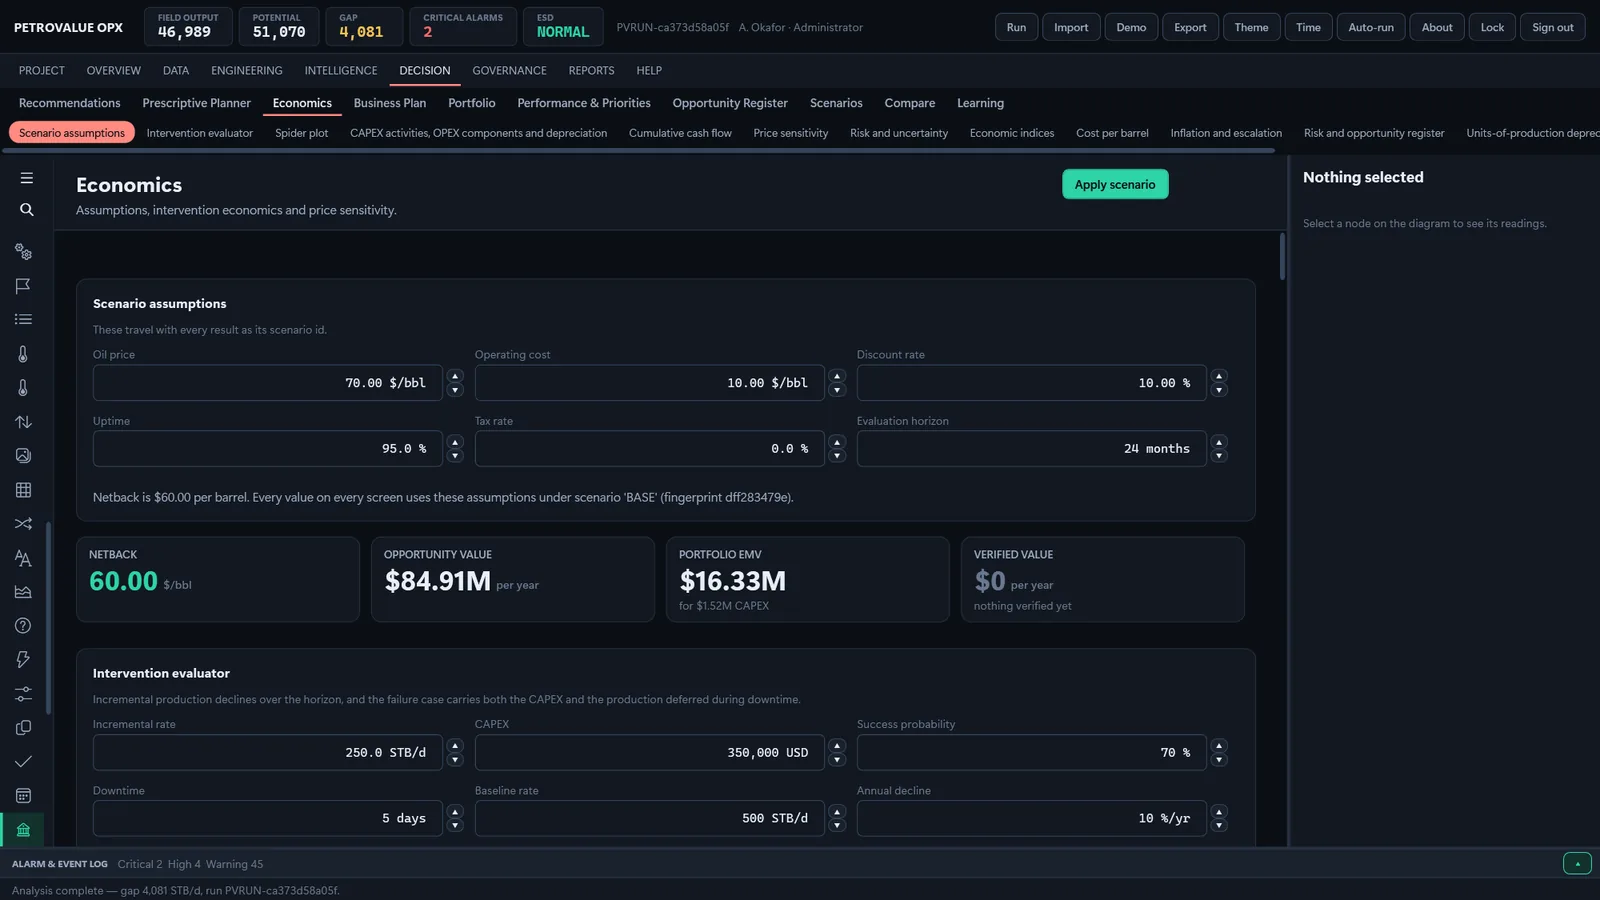
NPV, EMV, IRR and payout under your fiscal terms, with P90/P10 risk and low- and high-price scenarios.
Count value only when post-job uplift is sustained. Outcomes update success probabilities for the next ranking.
Built for whole fields
PETROVALUE analyses every well in parallel across all of the machine's cores. For each well it anchors a model to the measured rate, solves inflow against outflow, finds the binding constraint, diagnoses the loss, prices the opportunity and ranks the fix.
Measured 24 September 2026 on an Intel Core i7-1165G7 laptop (4 cores, 32 GB RAM): three runs of 69.9–72.6 s on the shipping build. The same harness on the same laptop ran in 50 s a day earlier, and re-running that older build today gives 61–67 s — so most of the difference is the machine, not the software, and this figure is the shape of the number rather than a guarantee. The run is the whole pipeline — data quality, surveillance, a nodal solve and technical potential for every well, diagnosis, loss attribution, prediction and a field-wide gas-lift allocation that returns a plan inside the plant’s limits — on 1,000 wells carrying two years of daily data, with processing capacity sized for the field. Your figure depends on your hardware and your data; ask us and we will measure it.
Inside the application
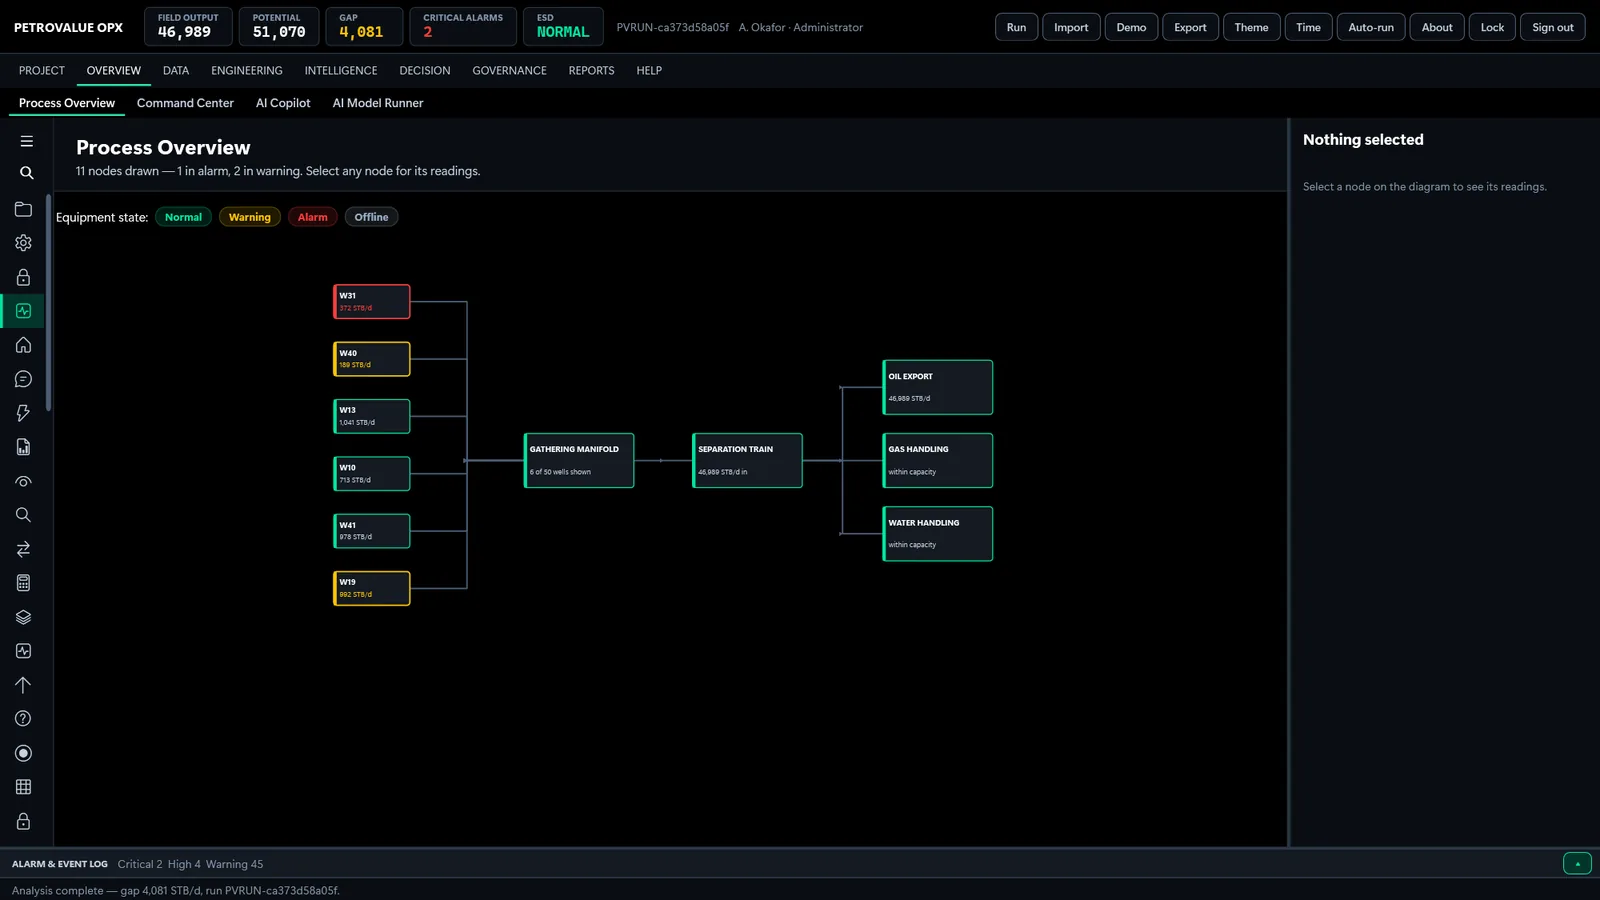
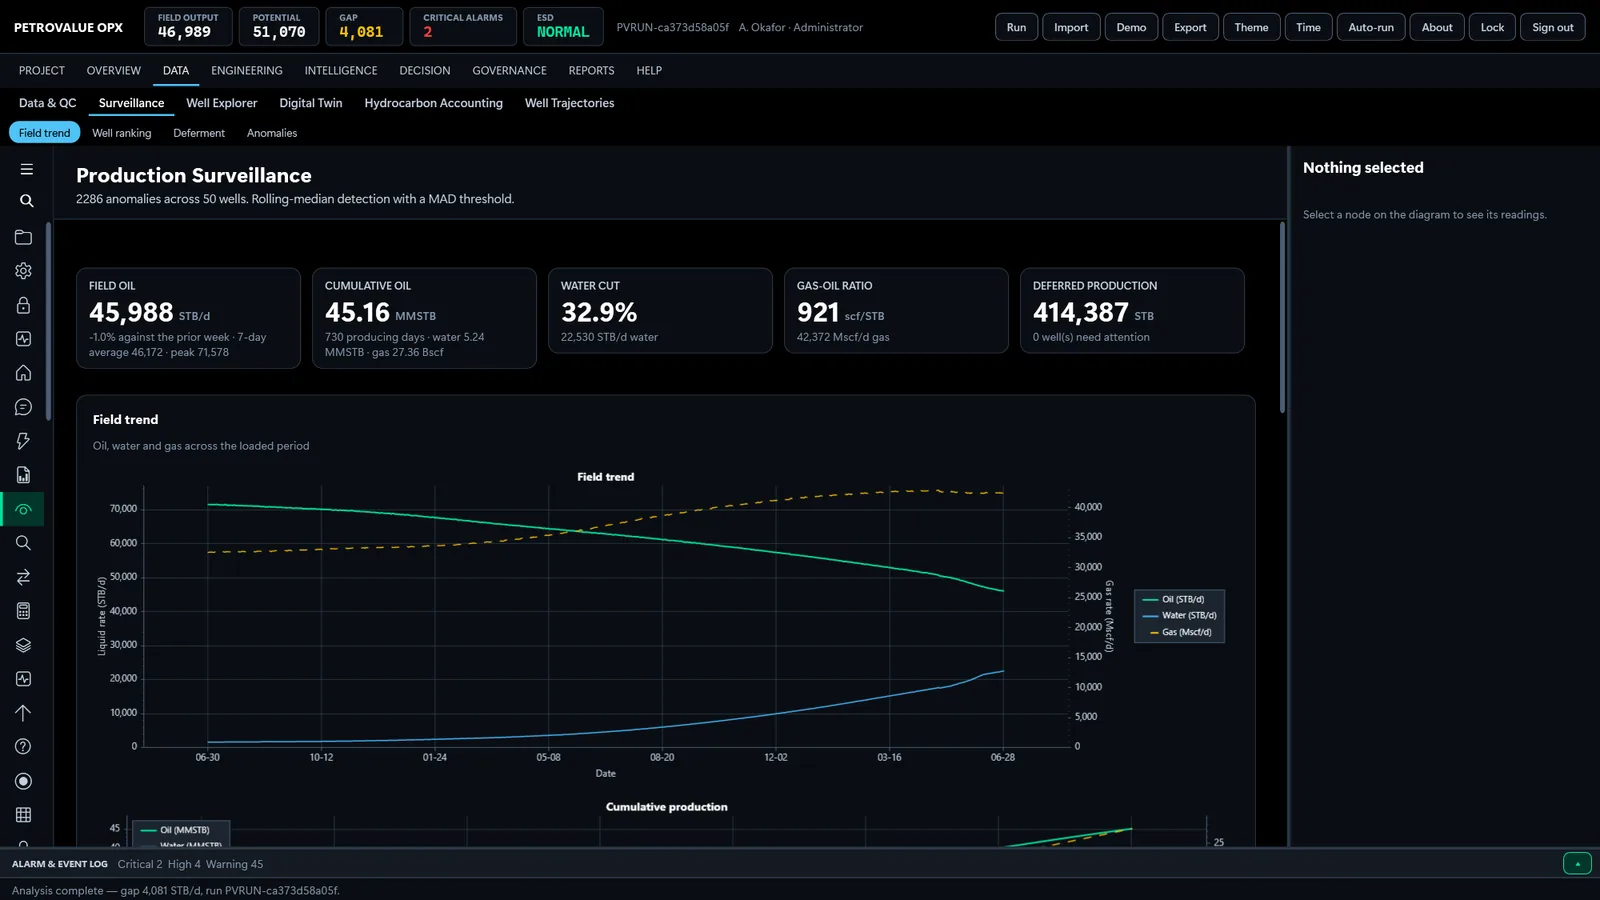
Every screen below is the real application running the built-in demo field. Choose a workspace to look closer.
Everything in the box
Every workspace reads the same analysis run, so a number in the Command Center, a diagnosis in Well Explorer and a line in the Field Report always agree. Here is all of it.
Engineering depth
Some decisions look small on paper and decide whether an engineer can trust the answer. These are enforced in code and asserted by the test suite.
A generic model routinely predicts less than a well is measurably making, so the gap turns negative and the opportunity vanishes. Anchoring fits productivity index and tubing friction to today's operating point — on the demo field, all 50 wells reproduce their measured operating point.
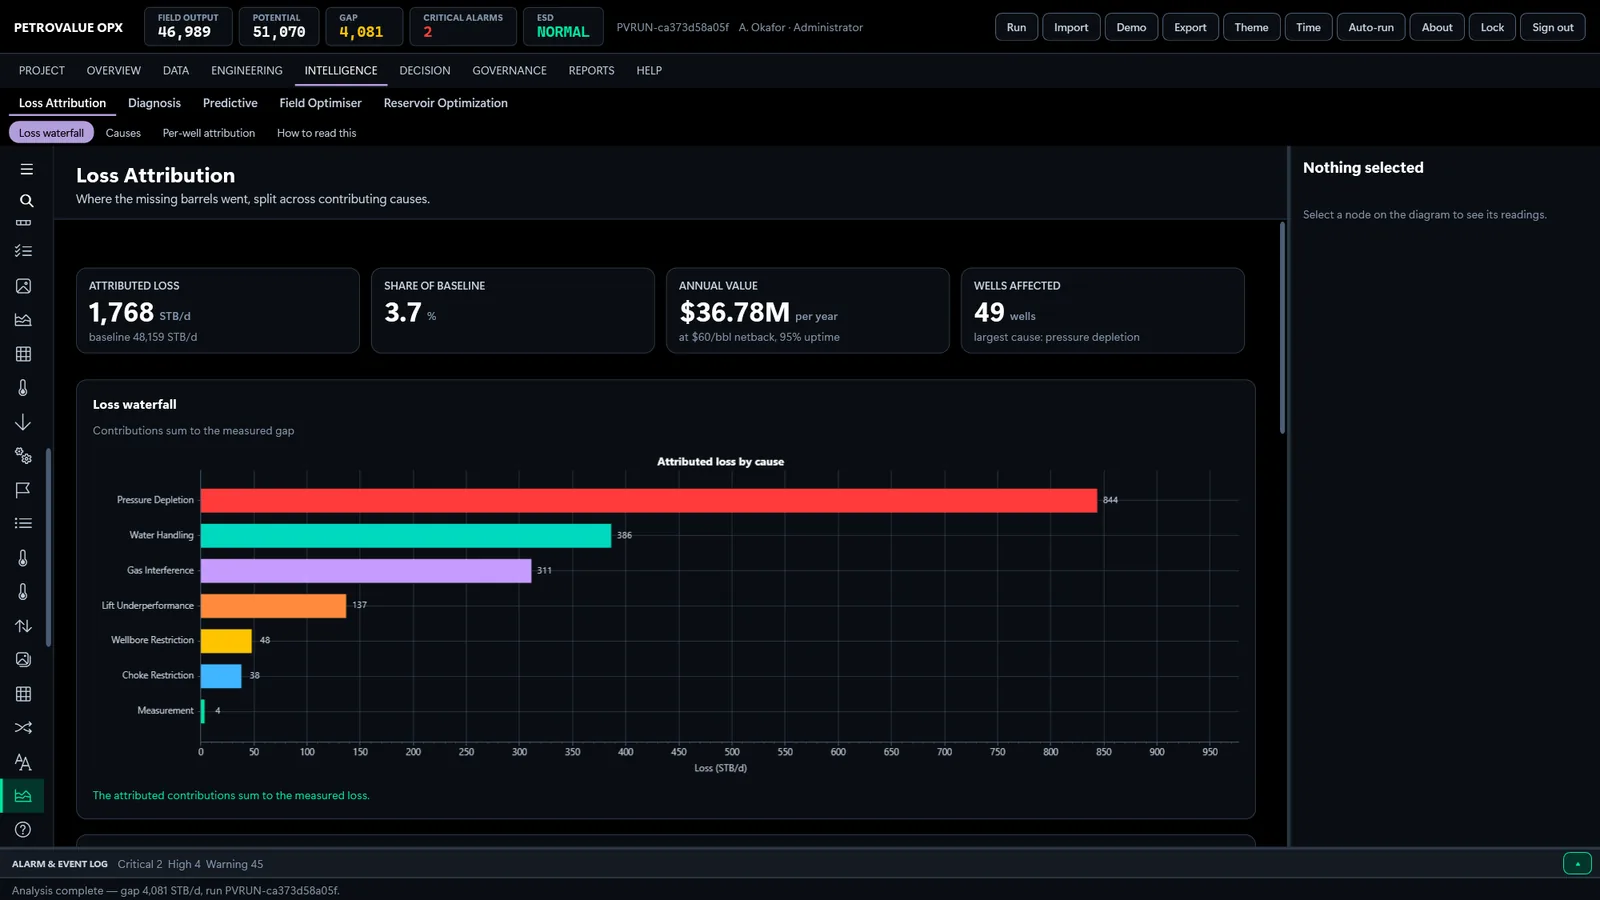
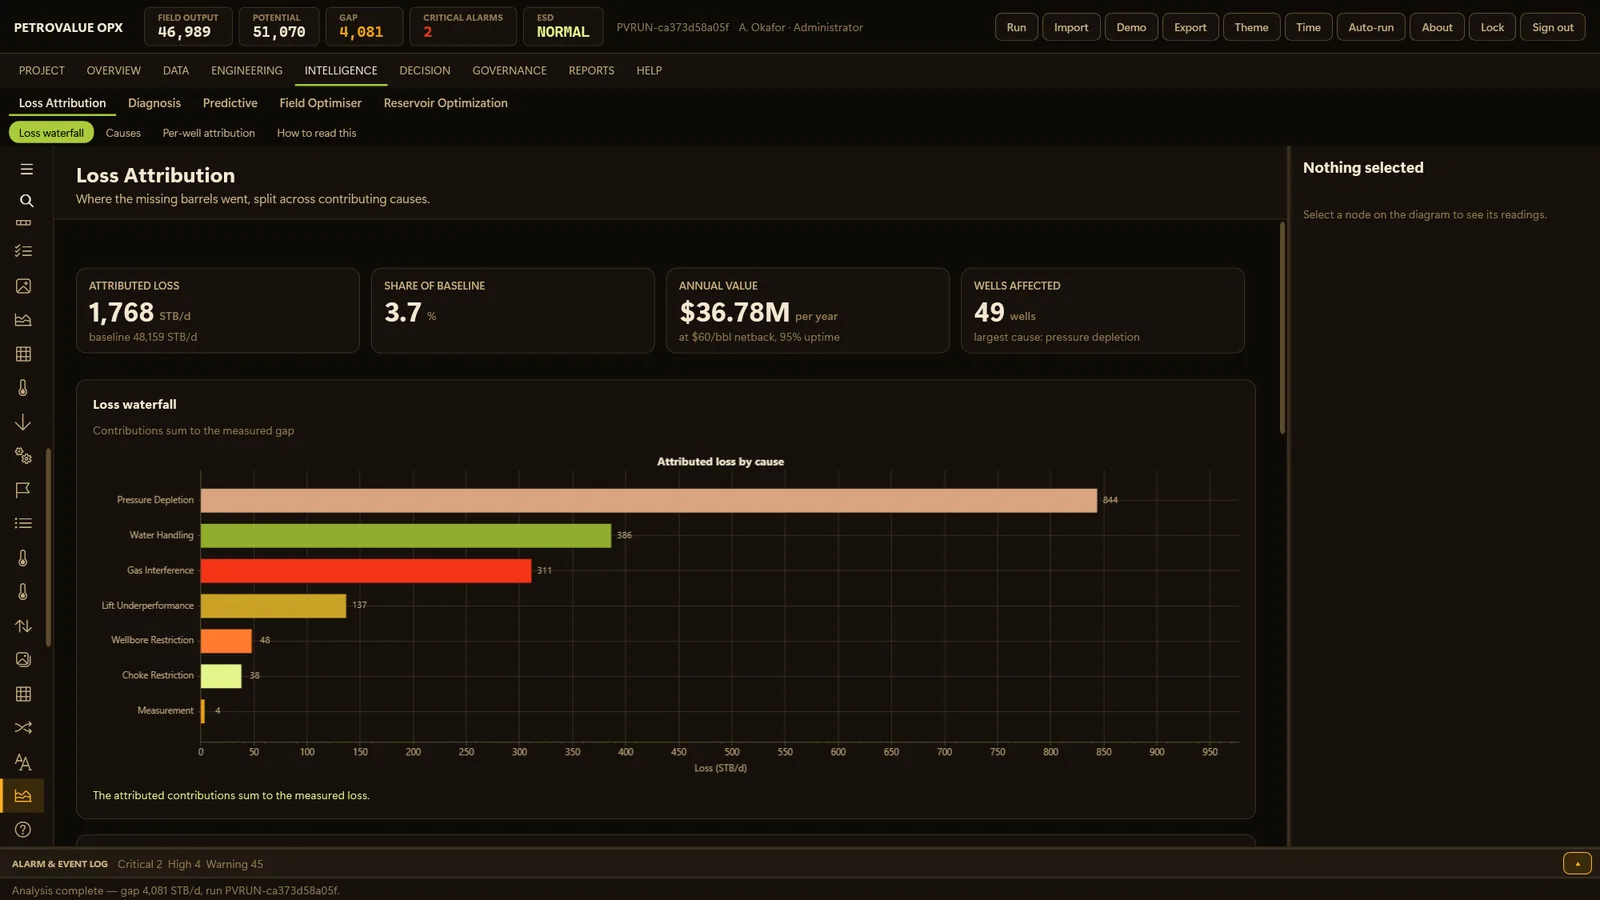
A well losing barrels to both water and a pinched choke is not recorded as water alone. Weighted attribution makes the loss waterfall sum to the measured loss.
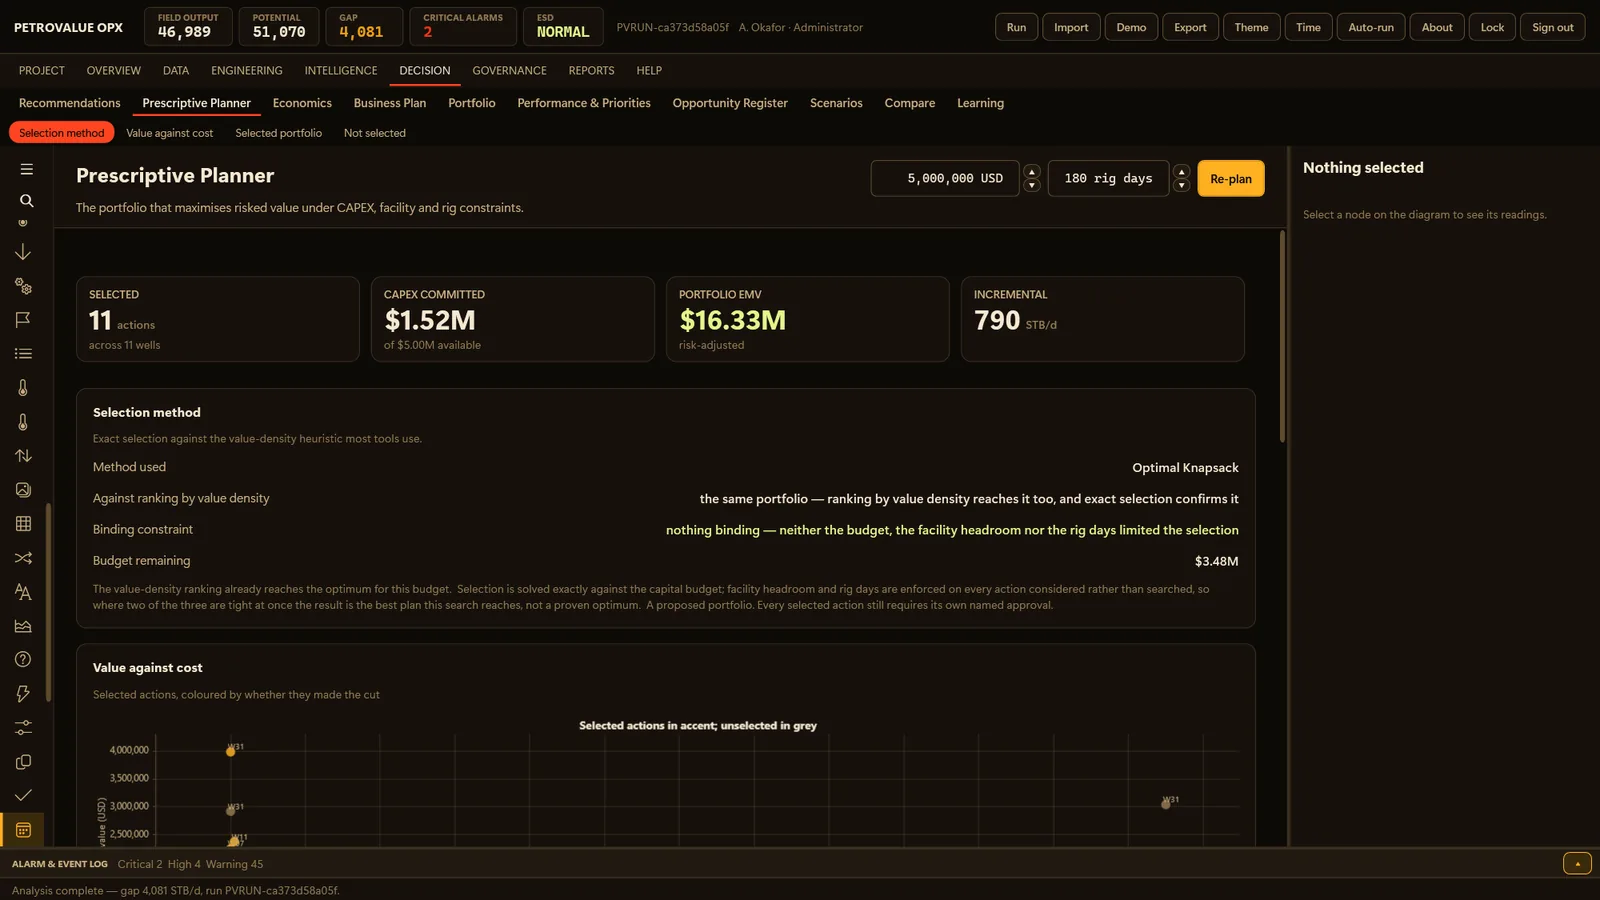
Ranking by value density can't see that skipping one large job frees budget for three smaller ones worth more together, and it cannot weigh a cheap fix against the better one it would rule out on the same well. The planner solves over the capital budget instead, with plant headroom and rig days enforced on every candidate, then reports what the comparison found — on the demo field, that the ranking arrives at the same portfolio. It also says where its own guarantee stops: with two limits tight at once, the answer is the best plan the search reaches, not a proven optimum.
A failed workover still costs its CAPEX and the production deferred during downtime, and incremental barrels decline over the evaluation horizon.
IRR returns nothing rather than an absurd annualised rate. Material balance refuses a volume its pressure record cannot support. When two methods disagree, the page says so rather than picking one.
| Area | What is implemented |
|---|---|
| PVT | Standing (Rs, Bo), Beggs–Robinson viscosity, z-factor — evaluated at each traverse segment's local pressure. Gas-condensate dew point and liquid dropout from an equation of state. |
| Inflow | Productivity index, Vogel, and a composite form across the bubble point; skin through Darcy's radial form, split into geometry, deviation and remaining damage. |
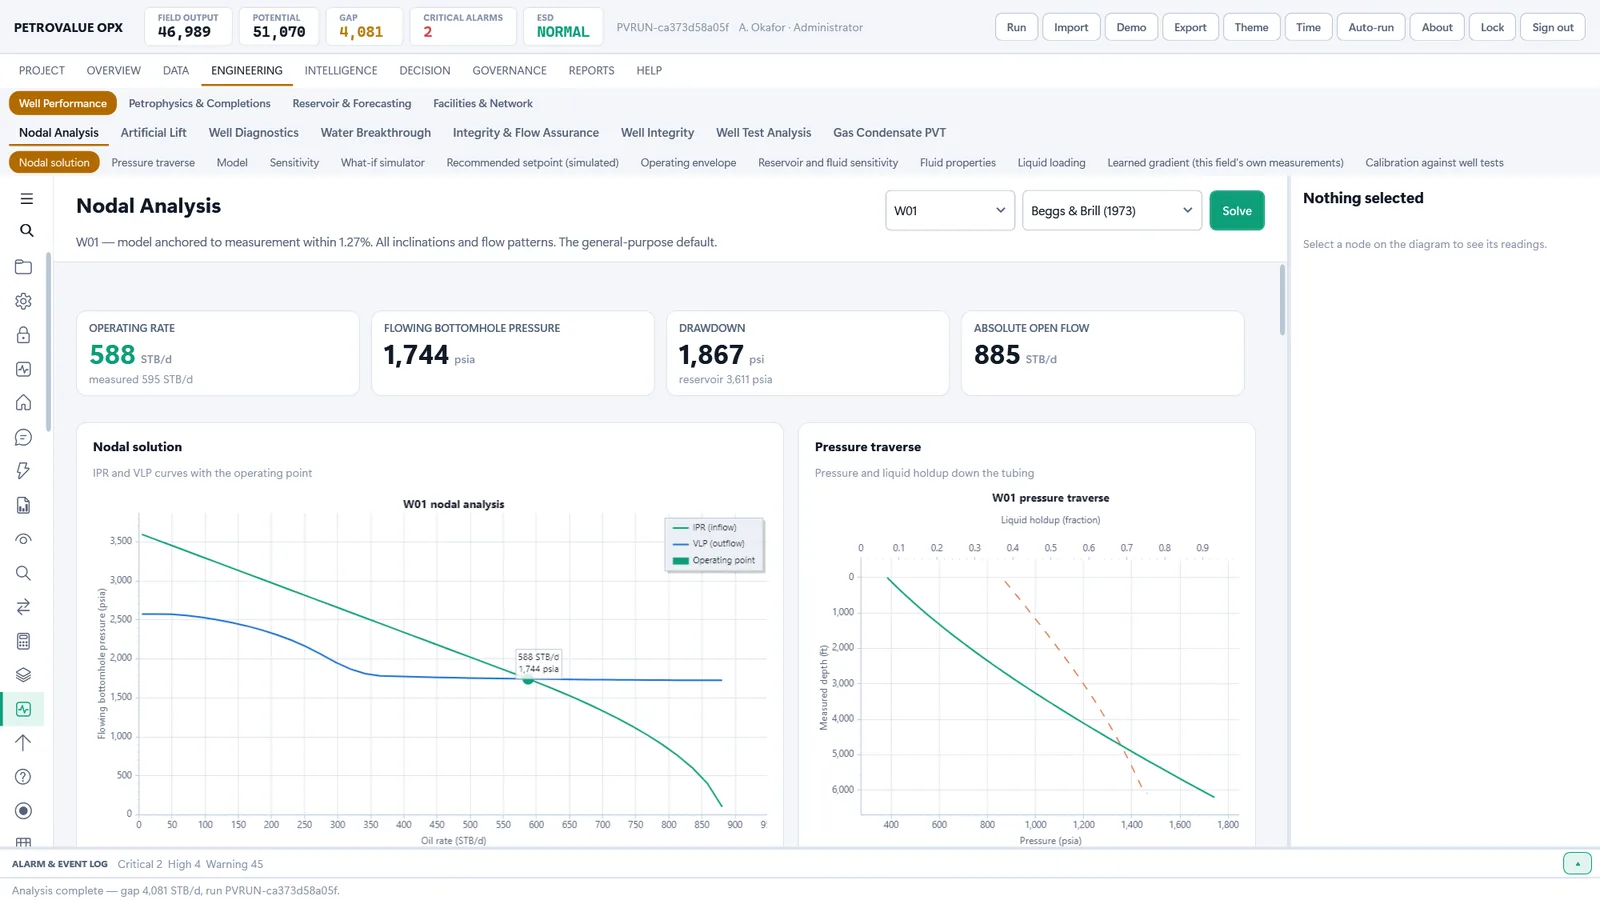
| Outflow | Beggs & Brill with the real flow-pattern map, holdup and inclination correction; Hagedorn & Brown; Duns & Ros — over a segmented traverse. |
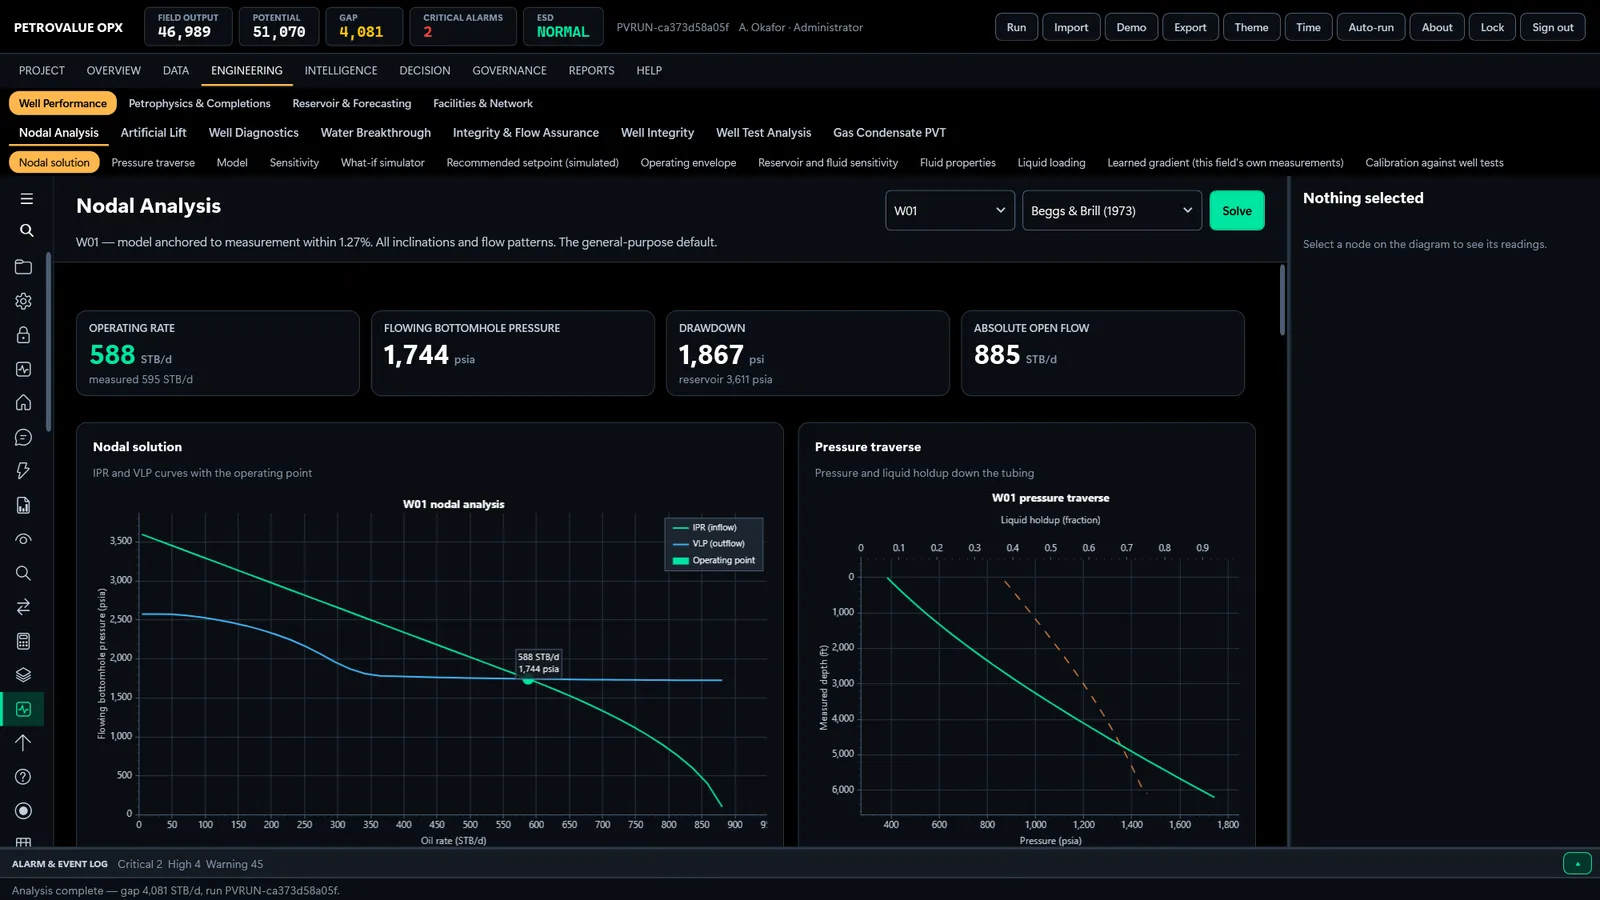
| Nodal & lift | Both roots of IPR = VLP; what-if choke, gas-lift and wellhead pressure; gas-lift and ESP screening with the economic optimum reported separately from the technical one; liquid-loading check. |
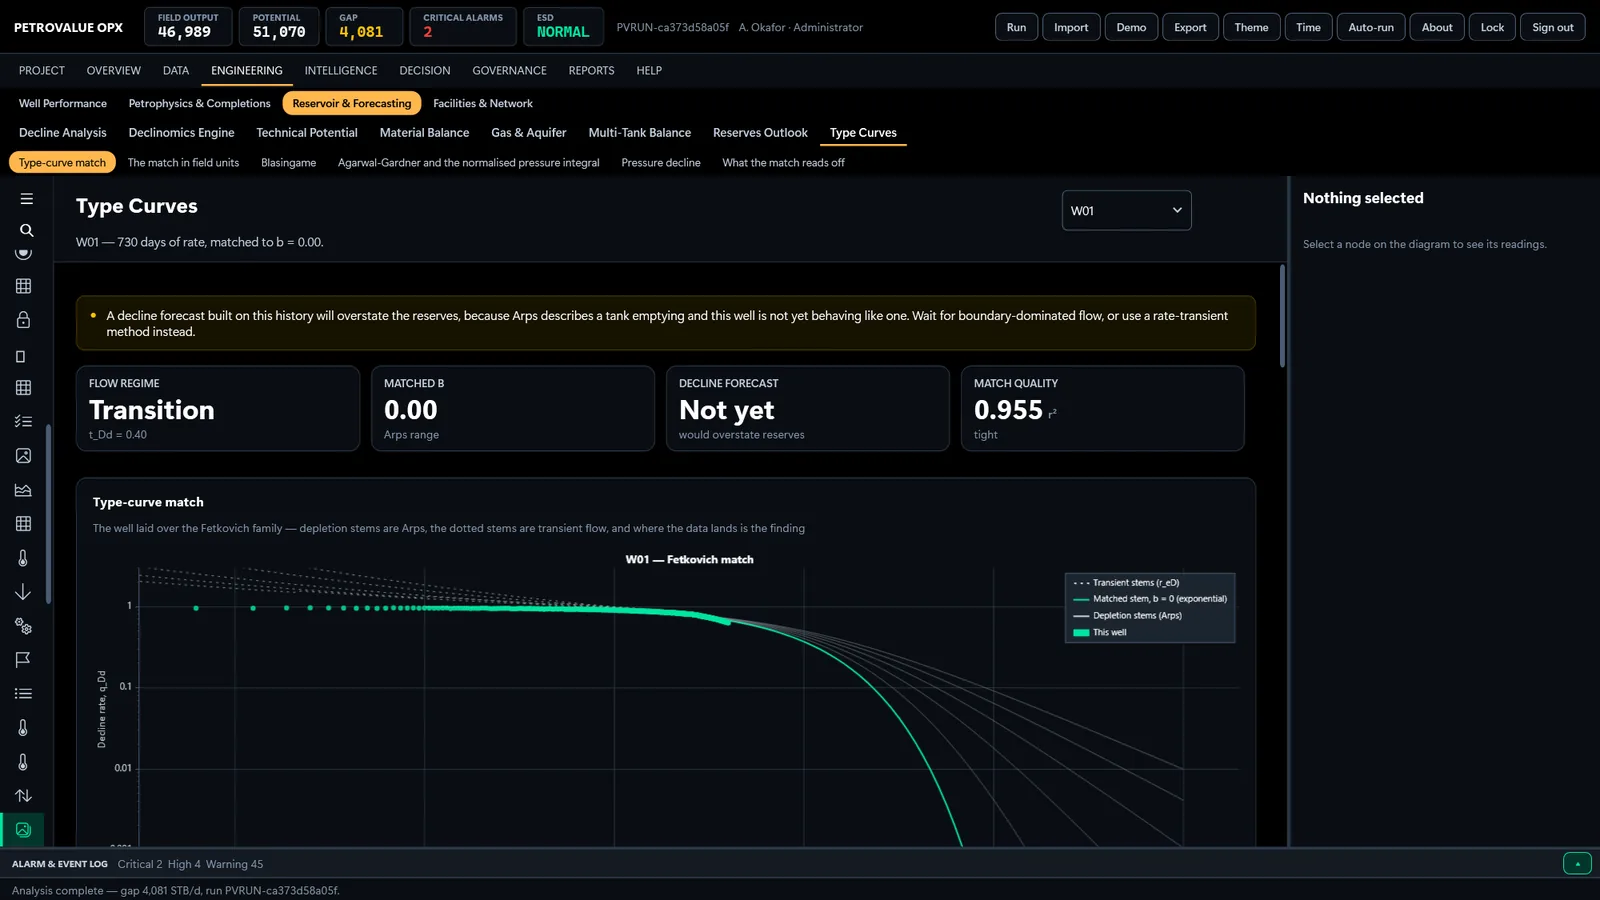
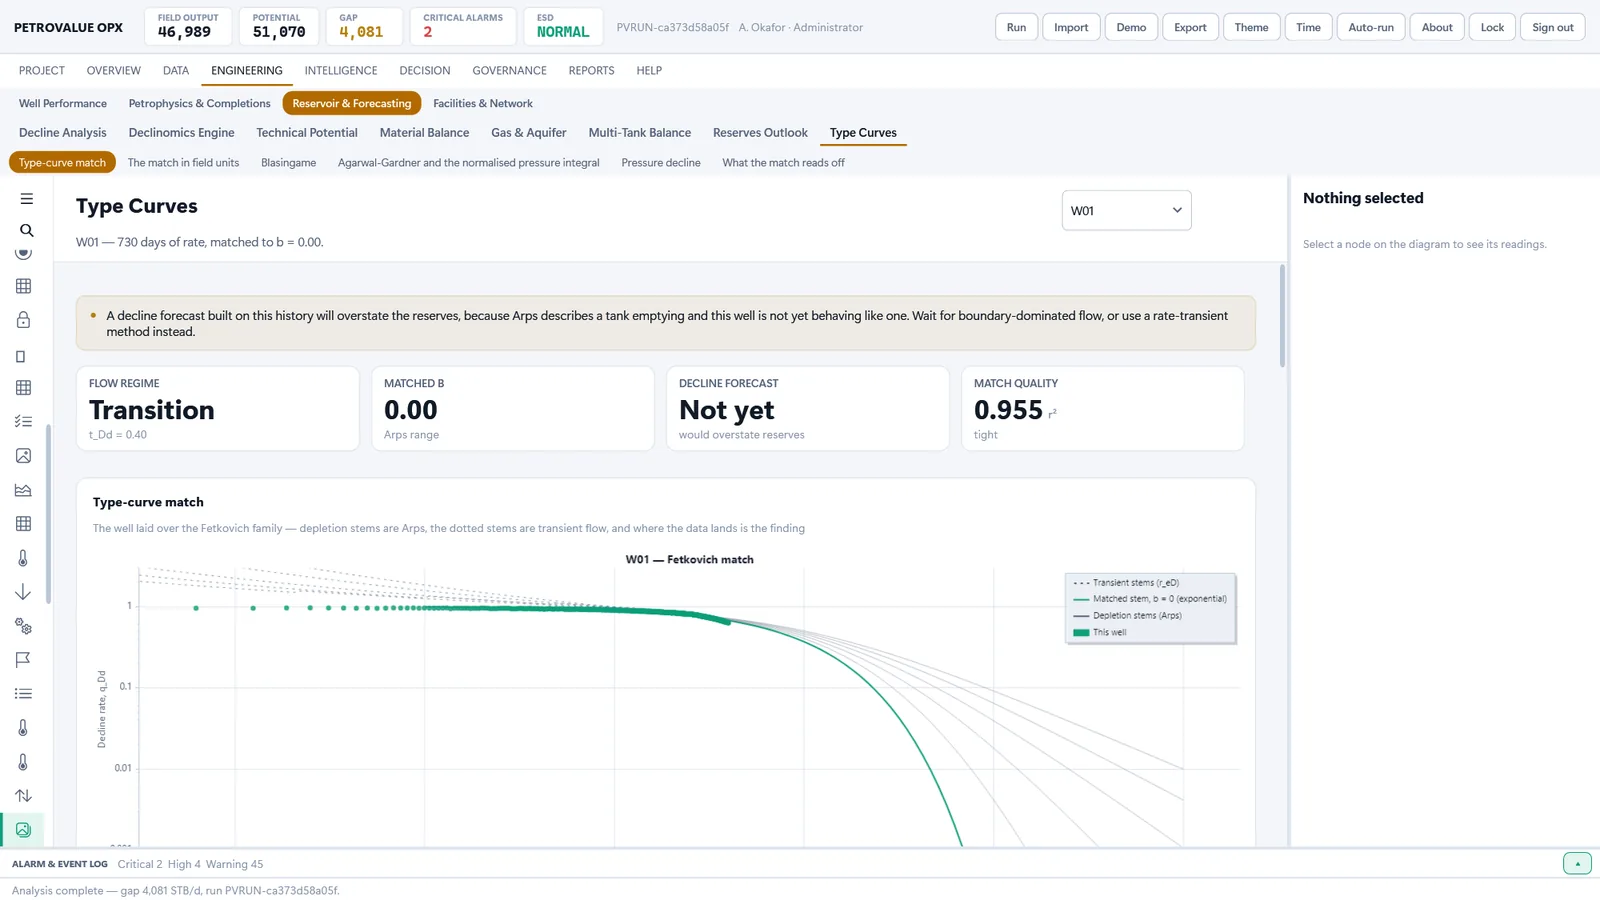
| Decline & type curves | Arps (b bounded 0–1), Duong and stretched exponential down to the economic limit; field-wide automated sweep; Fetkovich, Blasingame and Agarwal-Gardner diagnostics. |
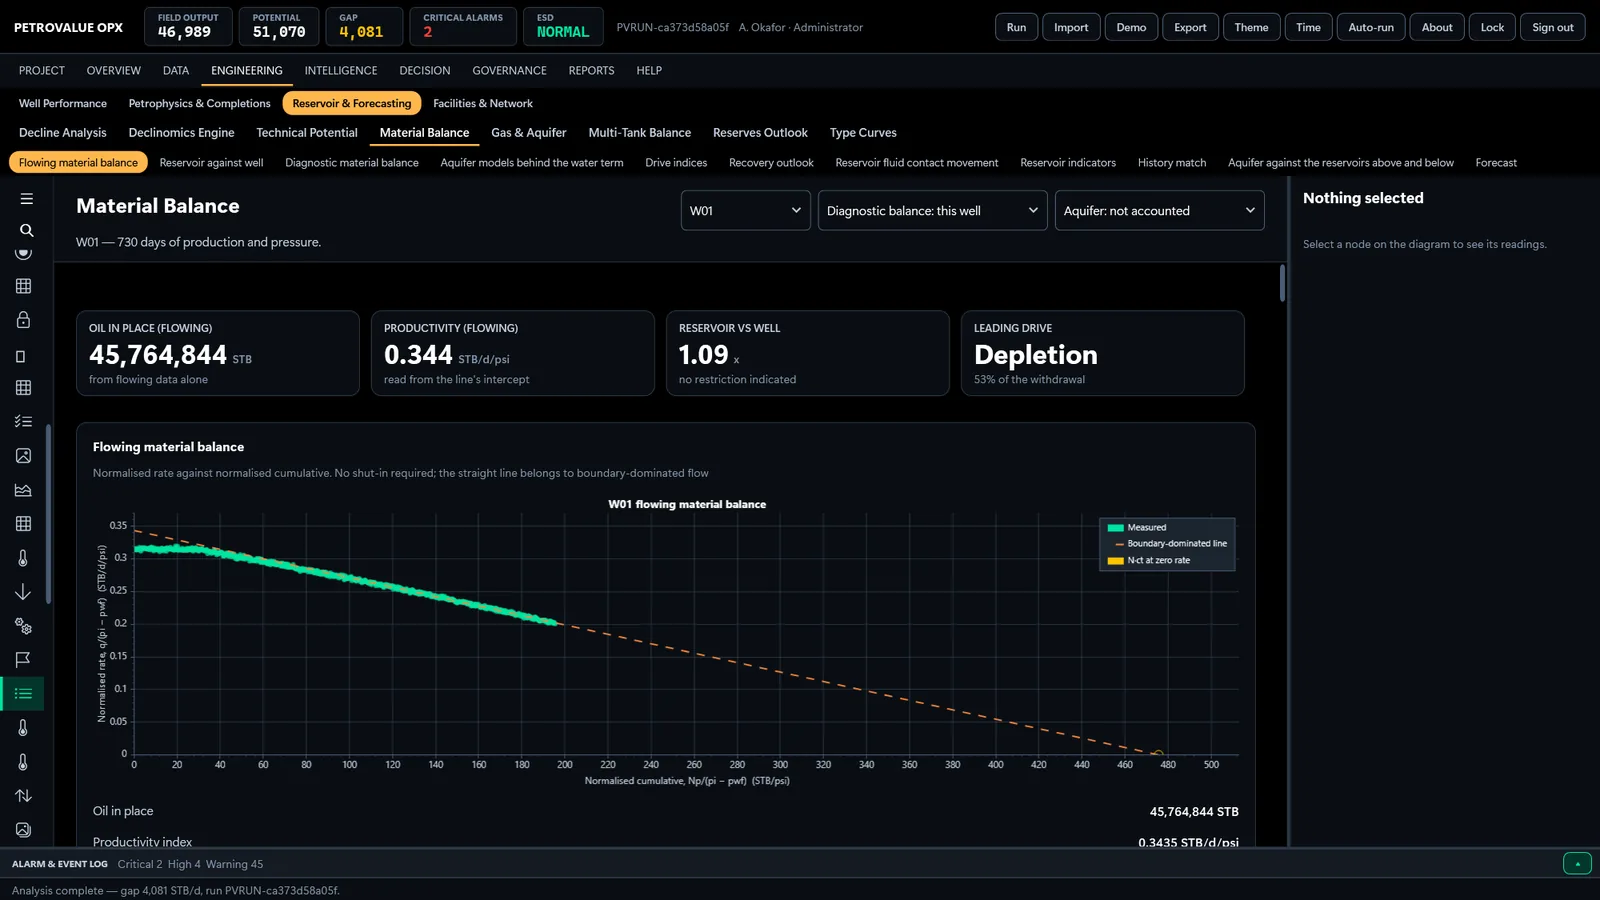
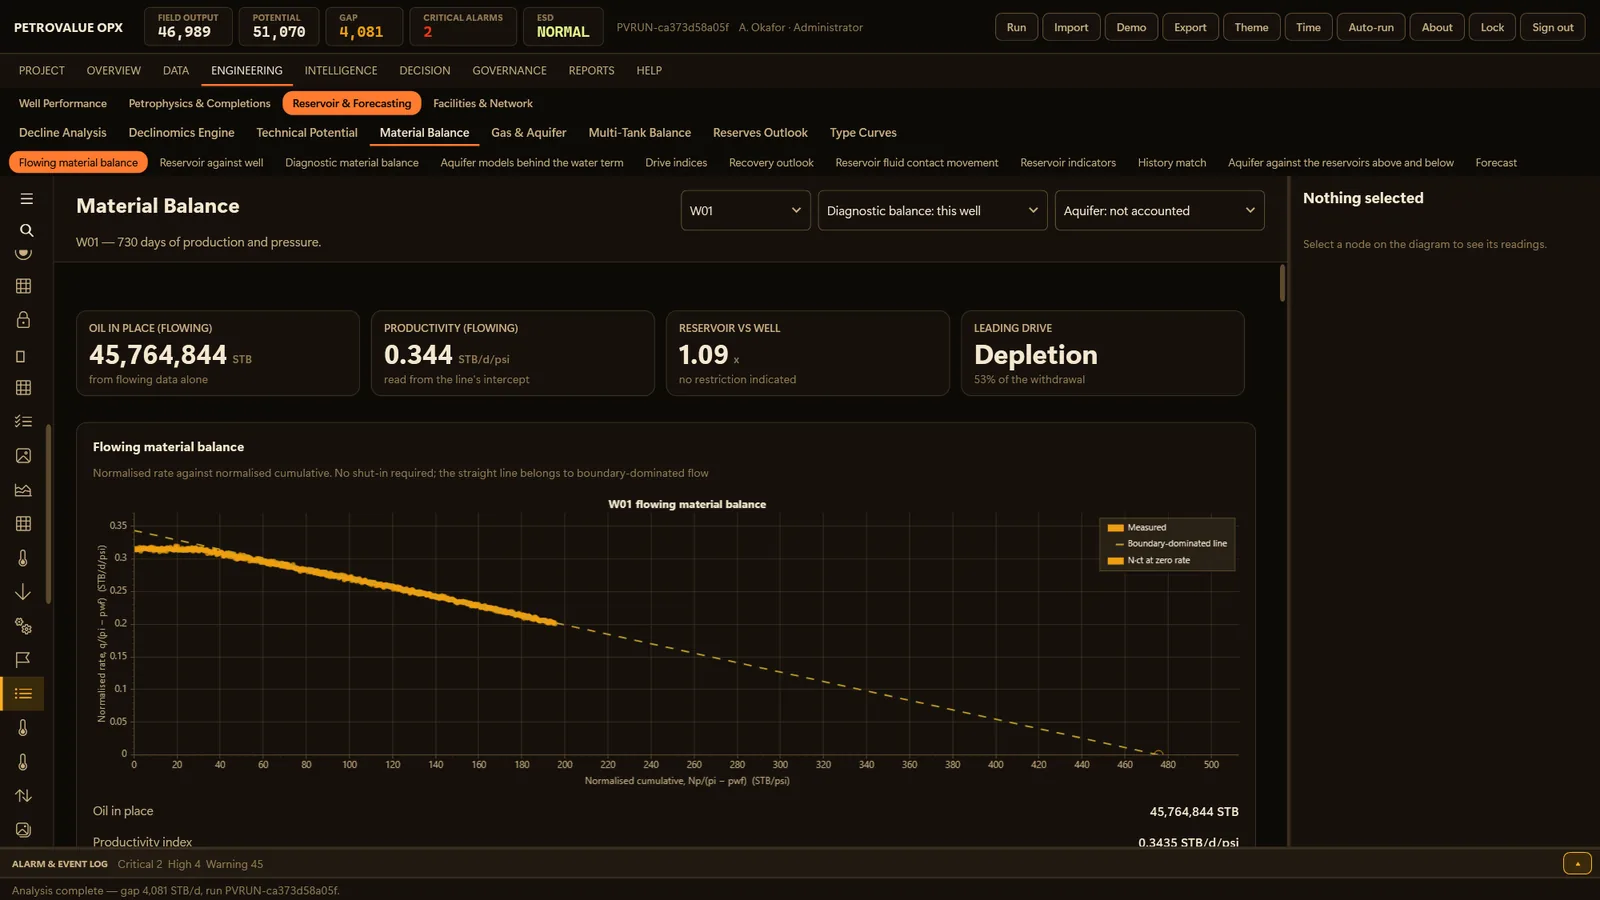
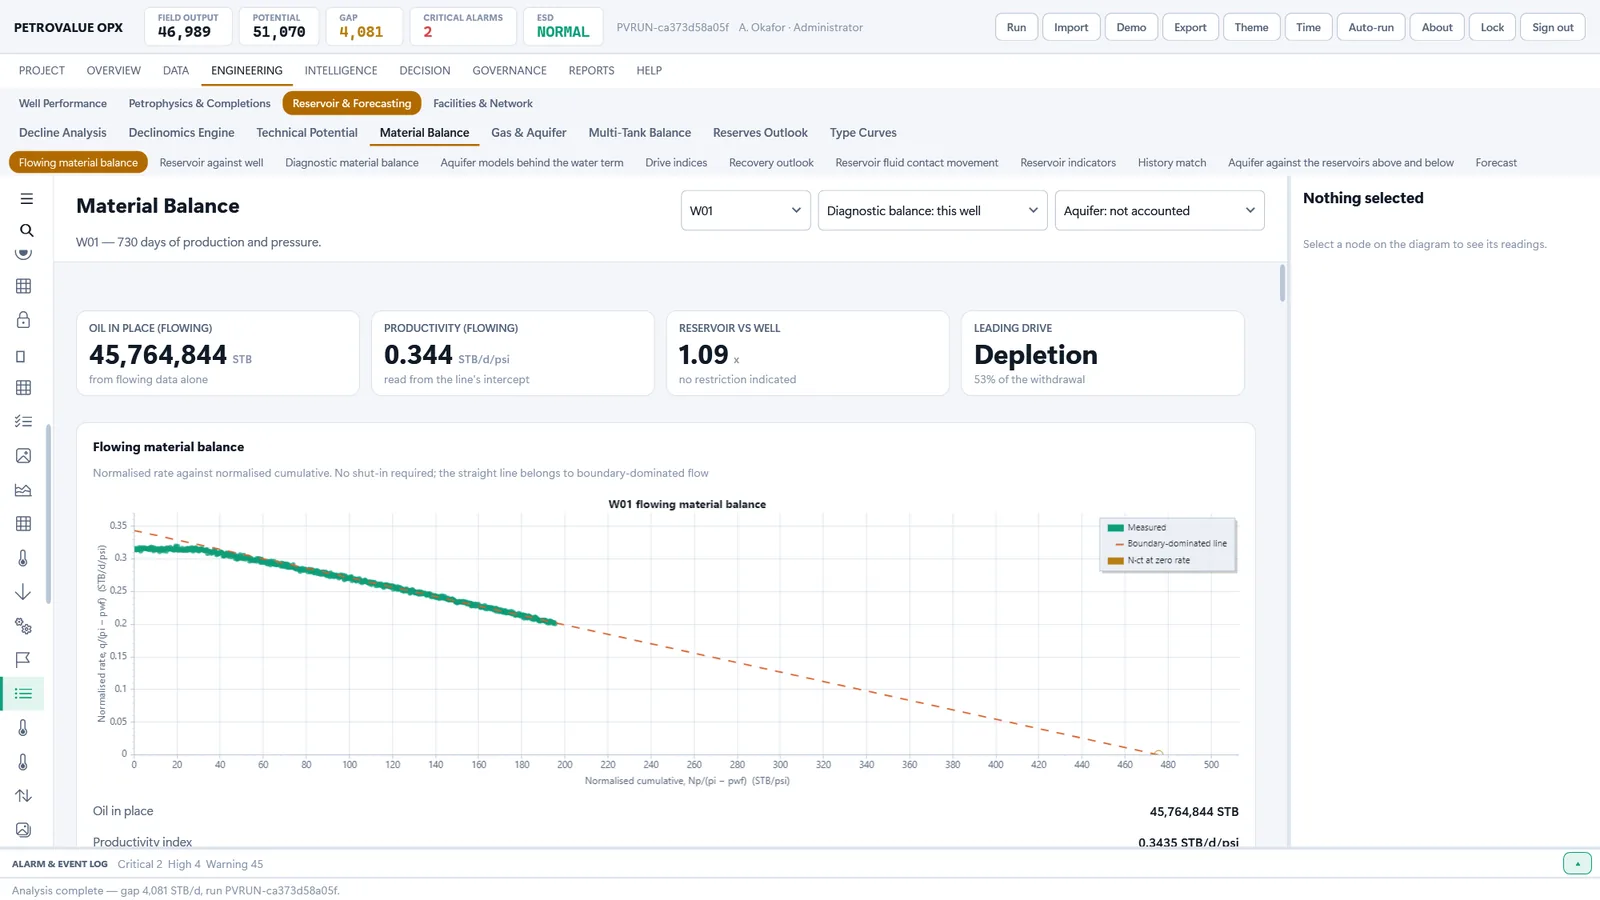
| Reservoir | Havlena-Odeh material balance with drive indices and contact movement; p/z for gas; three aquifer influx models; reserves outlook against empirical recovery factors. |
| Water | Chan diagnostic and Y-function to separate coning from channelling, with critical rate. |
| Integrity & completions | Sand production review that refuses a default rock strength; hydrate and flow-assurance screening along the line; zone-by-zone recompletion and ICV settings with crossflow between zones. |
| Network & facilities | Every well solved against one shared gathering network and separator; integrated model with one branch per reservoir that names the binding branch; pro-rata versus value-ranked allocation. |
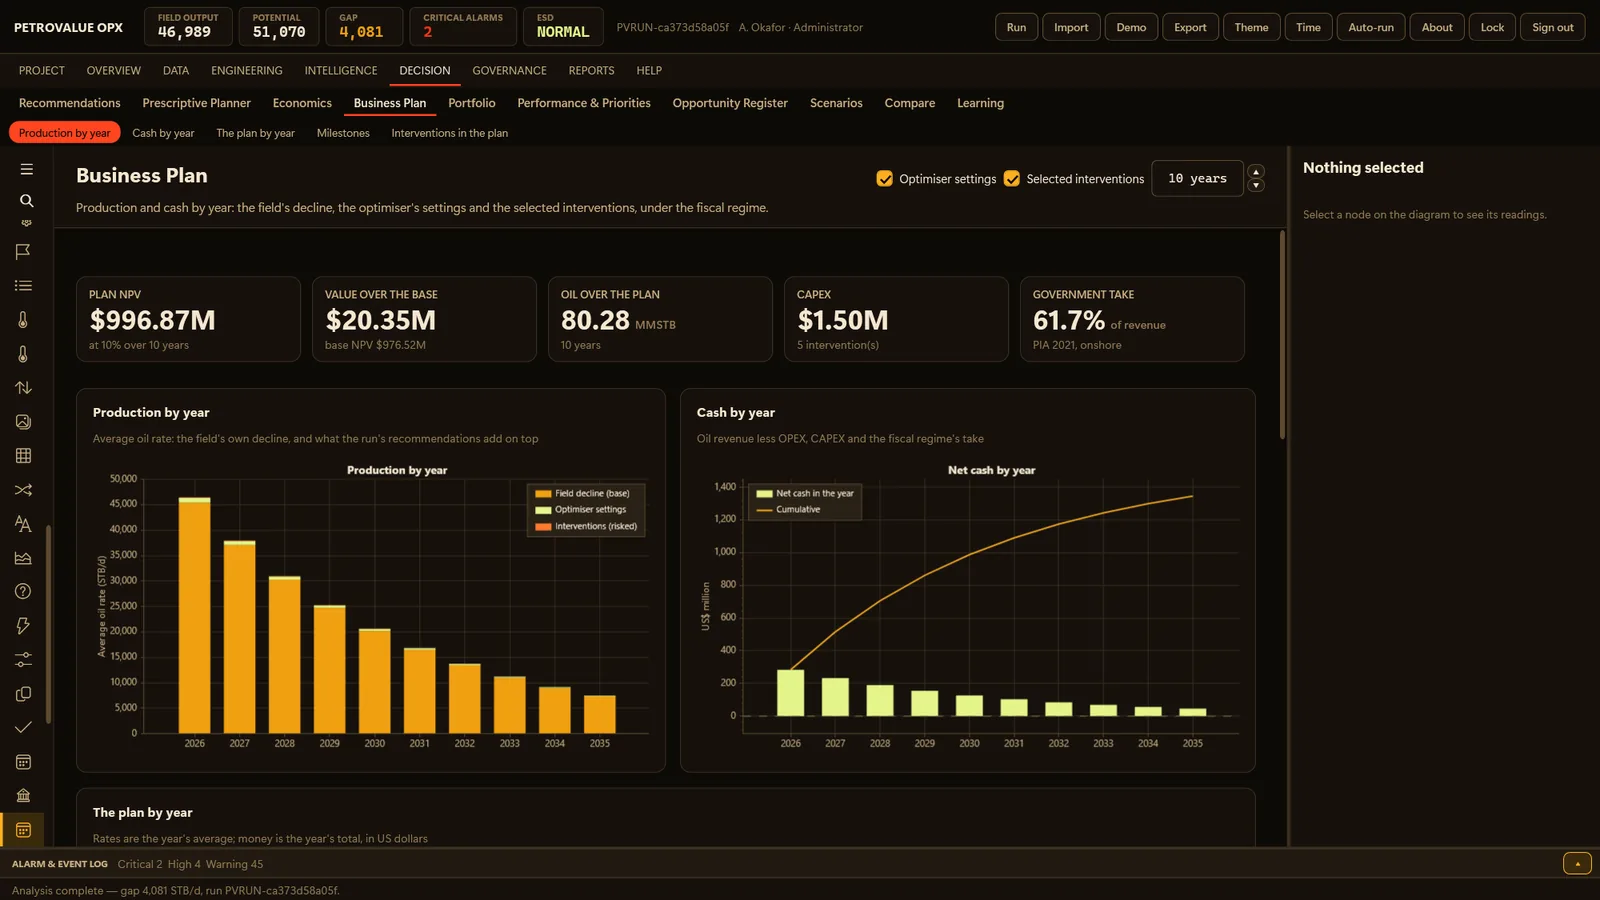
| Economics | NPV, EMV, IRR, payout, price sensitivity and P90/P10 risk; fiscal regimes by terrain, including the Nigerian regime; multi-scenario reruns of the whole pipeline. |
AI Copilot
Ask about the field in plain language — or by voice. The copilot routes your question to one of the registered engineering calculations, reads what it returned and explains it. Every figure traces to a tool call and carries an evidence label.
What is wrong with W16?
W16 — Wellbore restriction (high confidence, critical severity).
Production loss is 860 STB/d. The signal persisted on 21 of the days examined, which separates it from a one-day artefact.
Recommended next step: review tubing pressure drop, run a gauge or caliper, and check integrity indicators. The test that would confirm or refute this: a gauge run or caliper log locating the restriction.
This is an AI interpretation of measured signals, not a confirmed root cause.
Approve the workover on W16.
I can't approve or execute interventions. Approval requires a signed-in engineer with the Approve permission, and is recorded against that person in the audit trail.
Governance & security
These rules are enforced in code and asserted by the test suite — not written in a policy document and hoped for.
PETROVALUE never issues live well-control commands. The what-if simulator changes nothing measured and writes nowhere.
The digital twin raises a calibration candidate for review. Calibration returns a proposal, never a mutation.
Approval, execution authorisation and verification each refuse an automated actor, and are recorded against the signed-in person — never a typed name.
Evidence & Lineage shows the data snapshot, scenario, model versions, run identifier and the mix of observed, calculated and assumed evidence.
Results are recomputed when a project opens, so a number cannot outlive its assumptions. Changing the scenario marks the run stale.
Password policy, lockout, idle lock; Viewer, Engineer, Approver and Administrator roles; append-only audit trail; no default credentials.
Validation
Every field here is generated forward from physical causes — nodal solved per well, per day — with faults planted inside it at random onsets and severities, and healthy wells carrying harmless disturbances. Diagnosis has to find them through real mechanisms. The score that counts is on 96 fields that were held out when the engine was tuned.
2,365/2,365faults named on held-out fields · 0 of 1,475 healthy wells accused
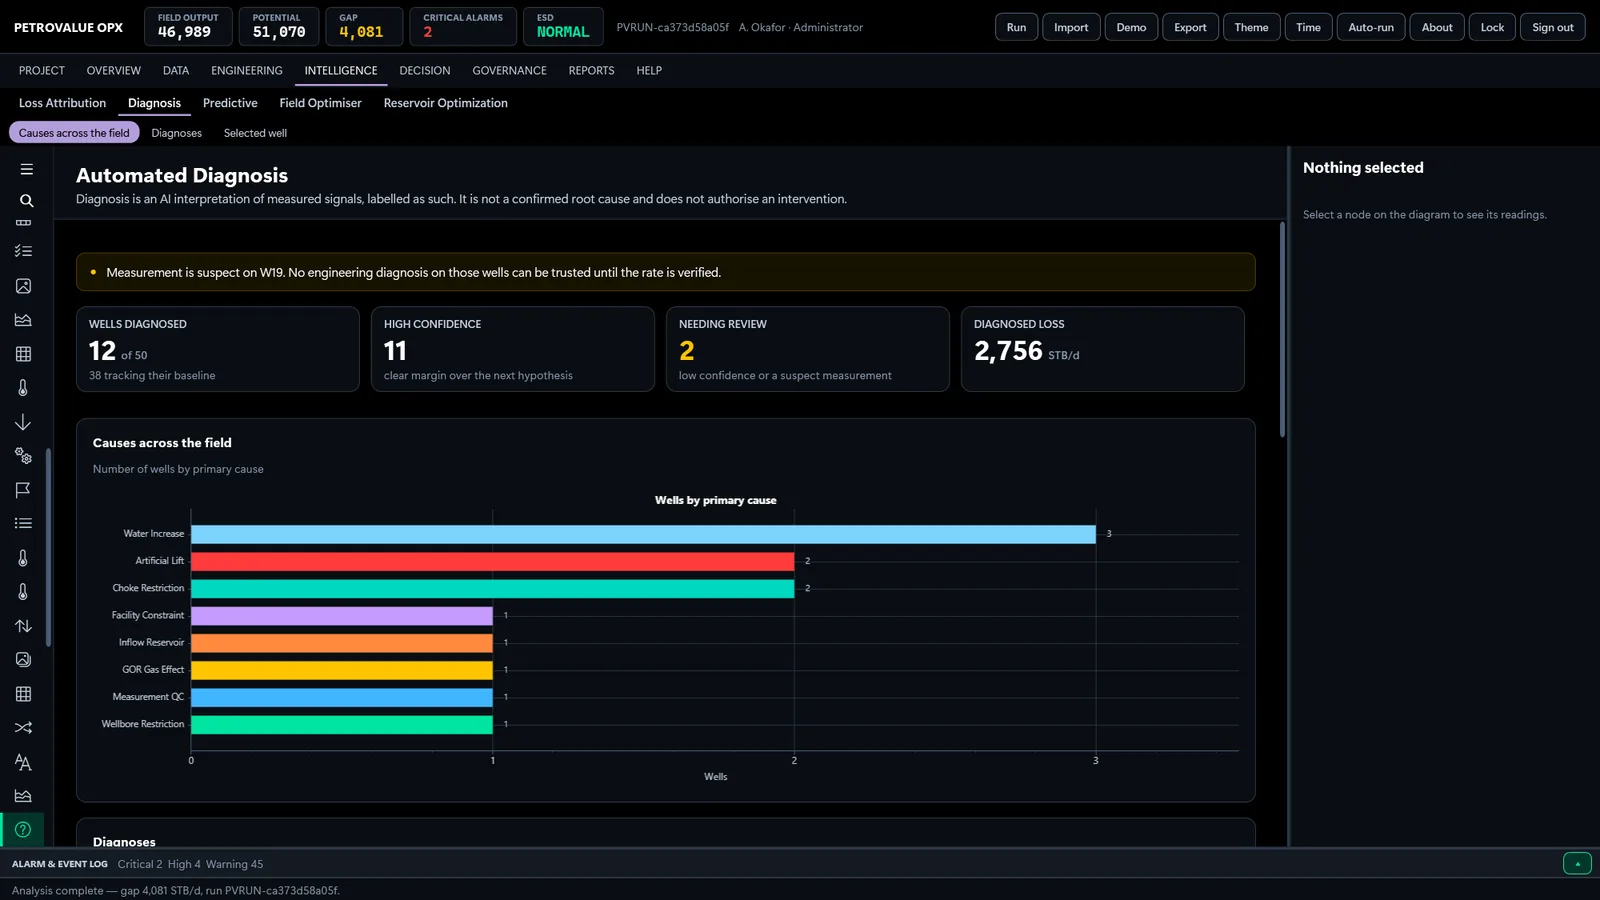
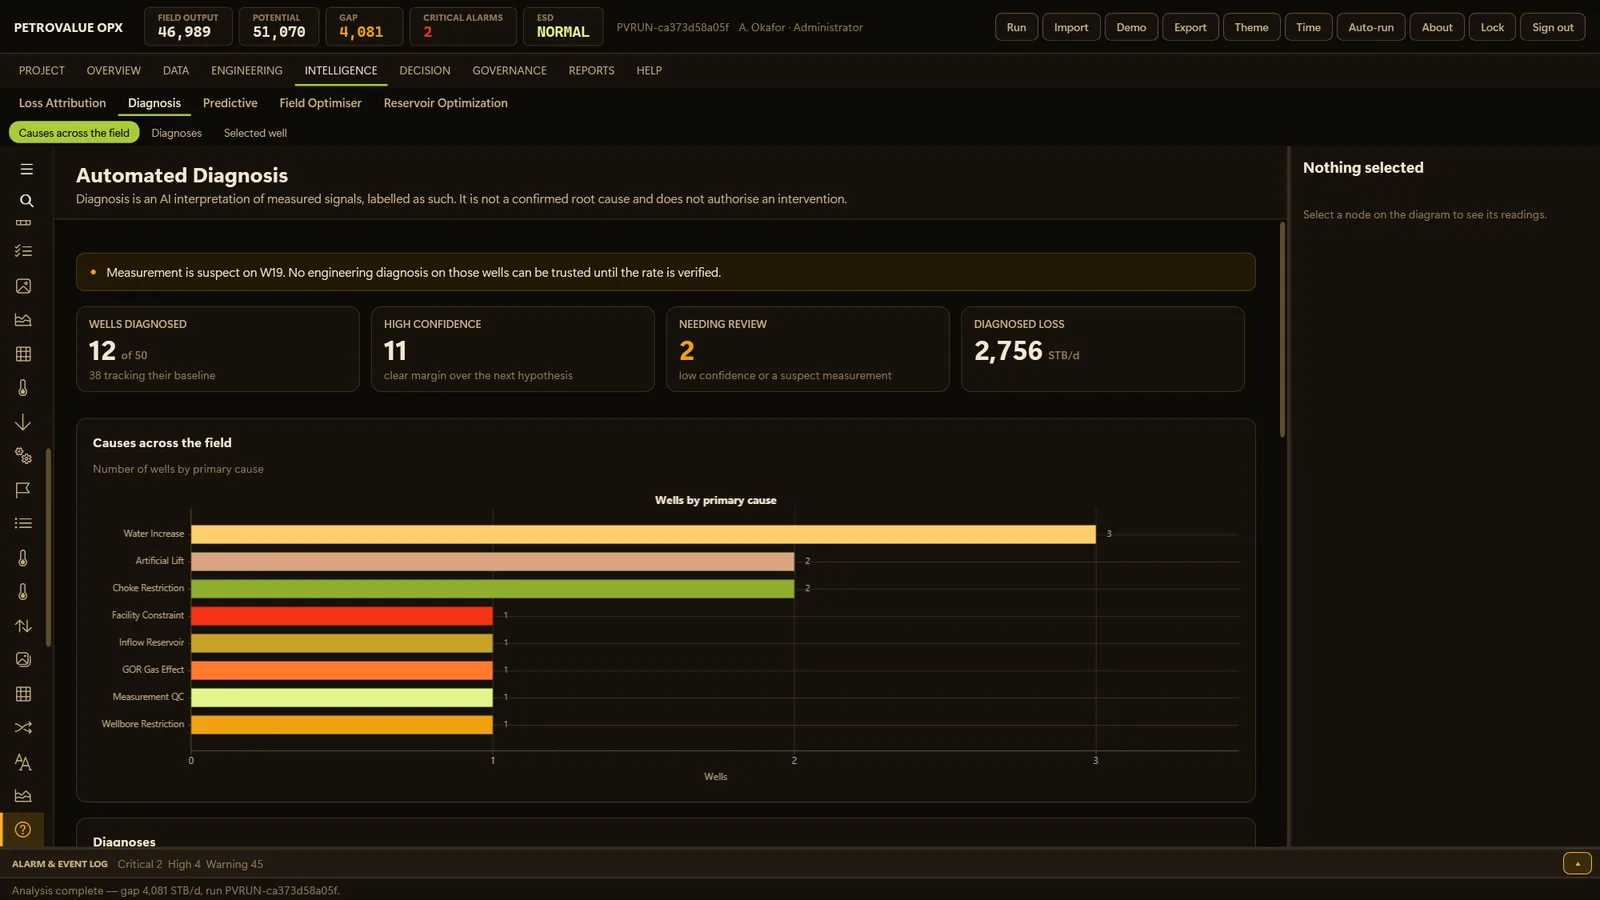
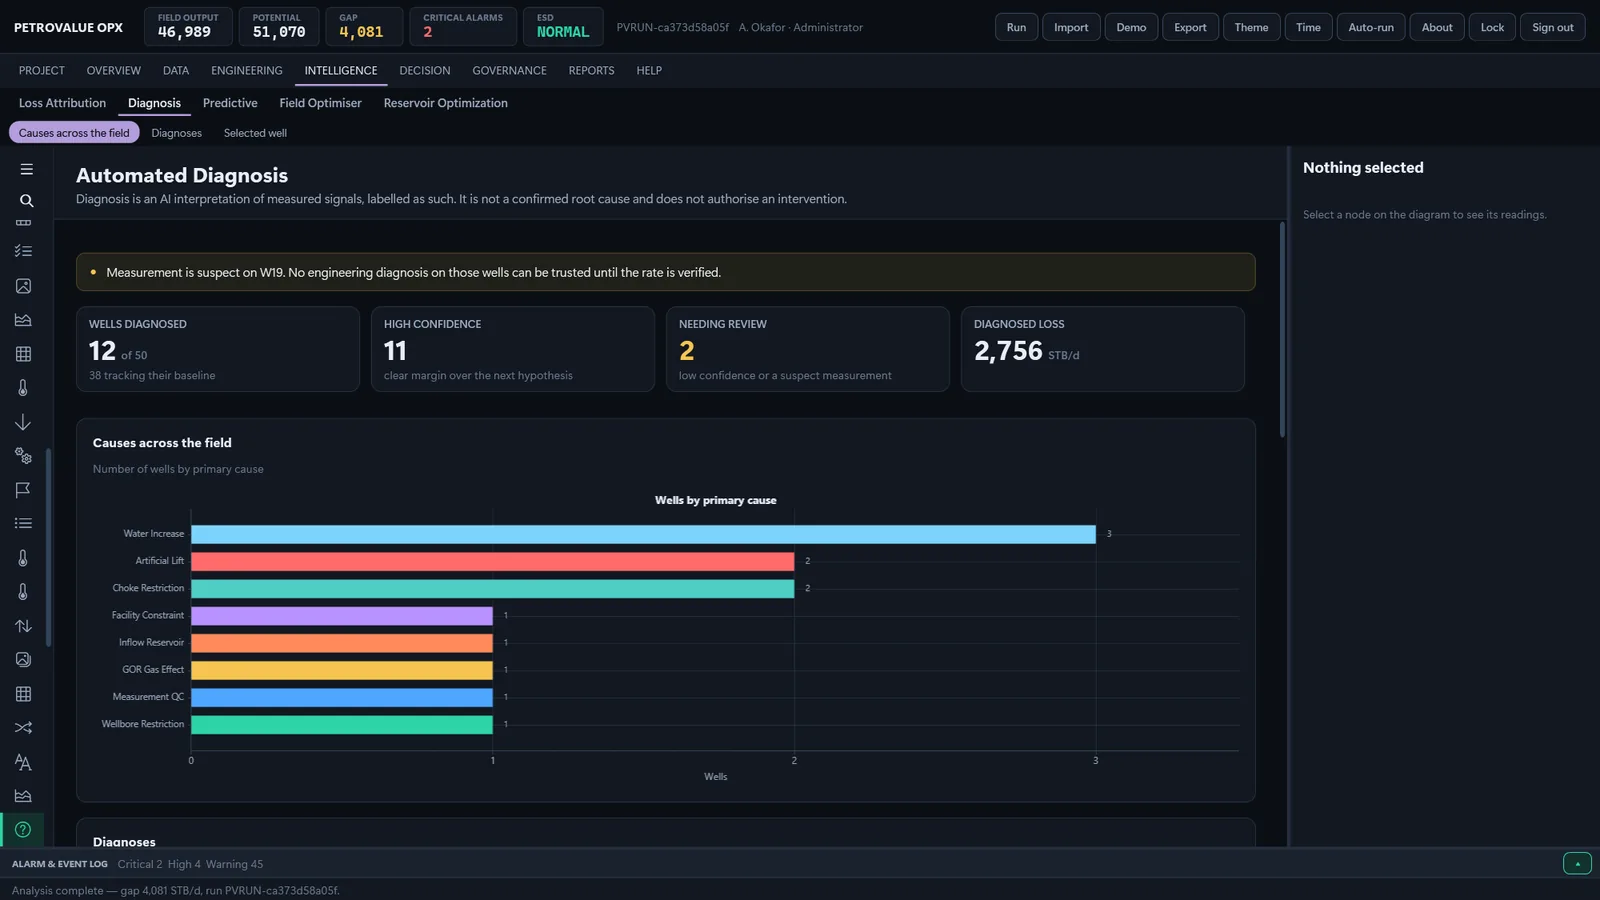
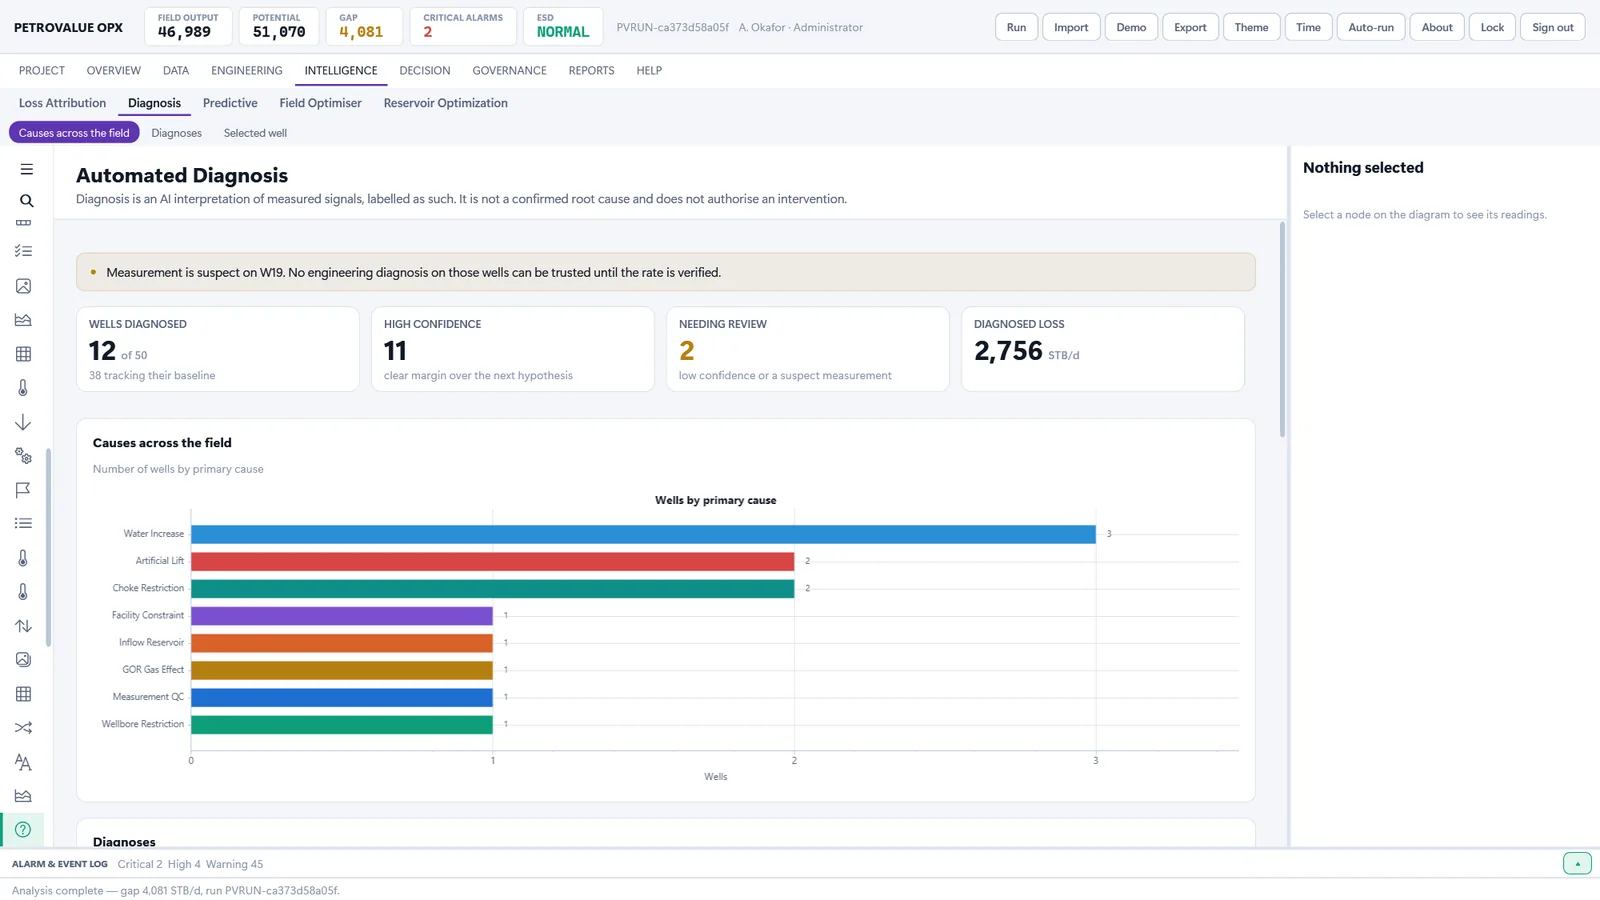
Choke position separates backpressure from a pinched choke; productivity-index decline separates skin damage from depletion; rising drawdown with flat wellhead pressure marks lift degradation. On the demo field every planted fault is named exactly, and no well without one is flagged.
Built for the control room
Switch with one click in the header; every chart redraws in the new palette. The same Command Center, the same run, four ways.
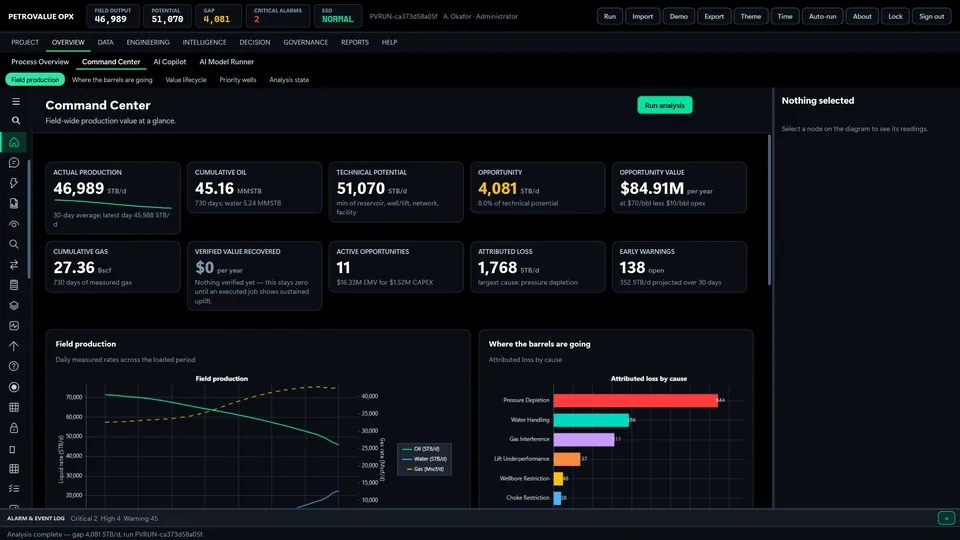
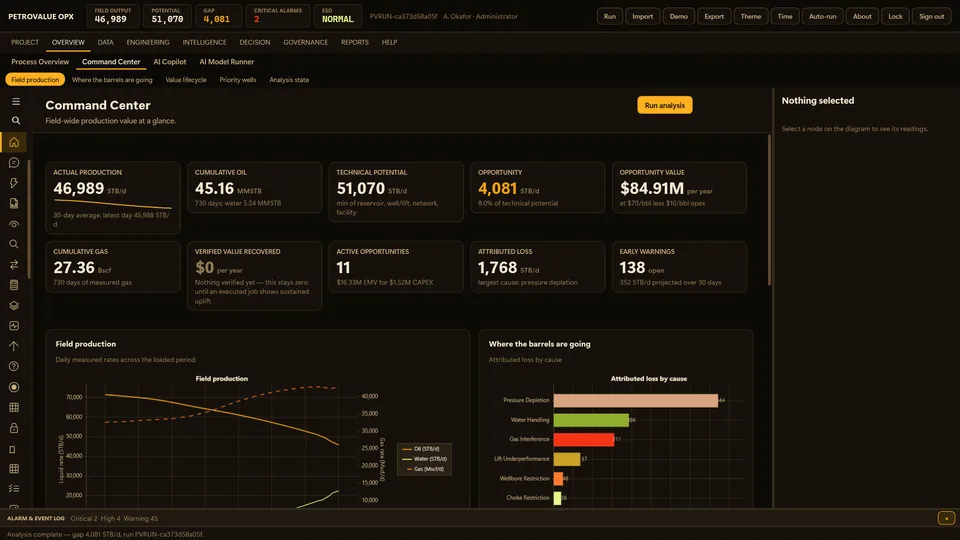
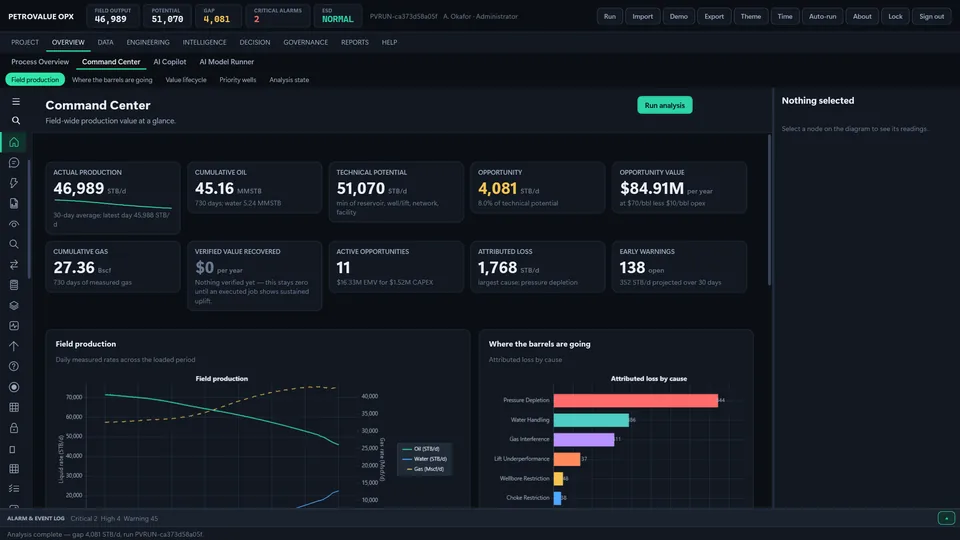
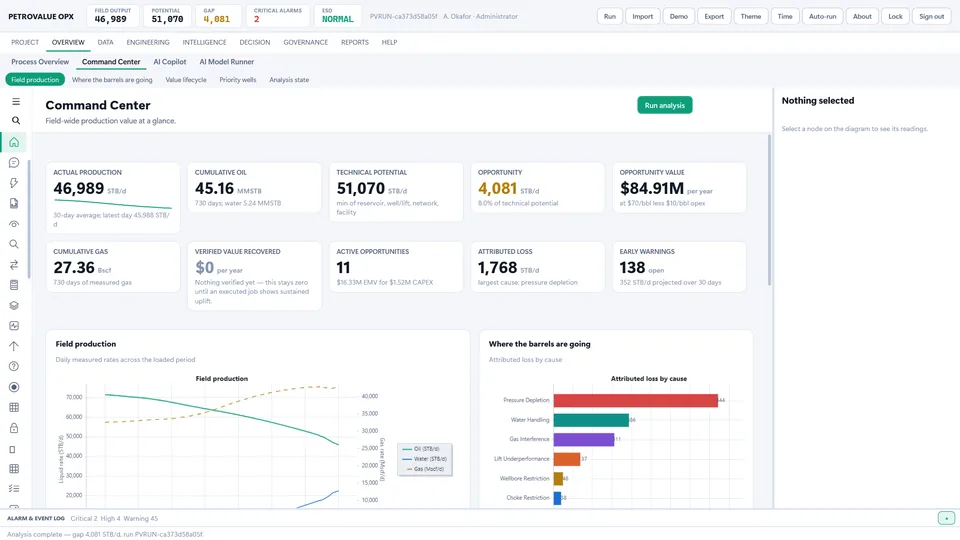
The palette is not applied to one screen. It carries into every workspace — see eleven of them, in all four themes.
Screenshot gallery
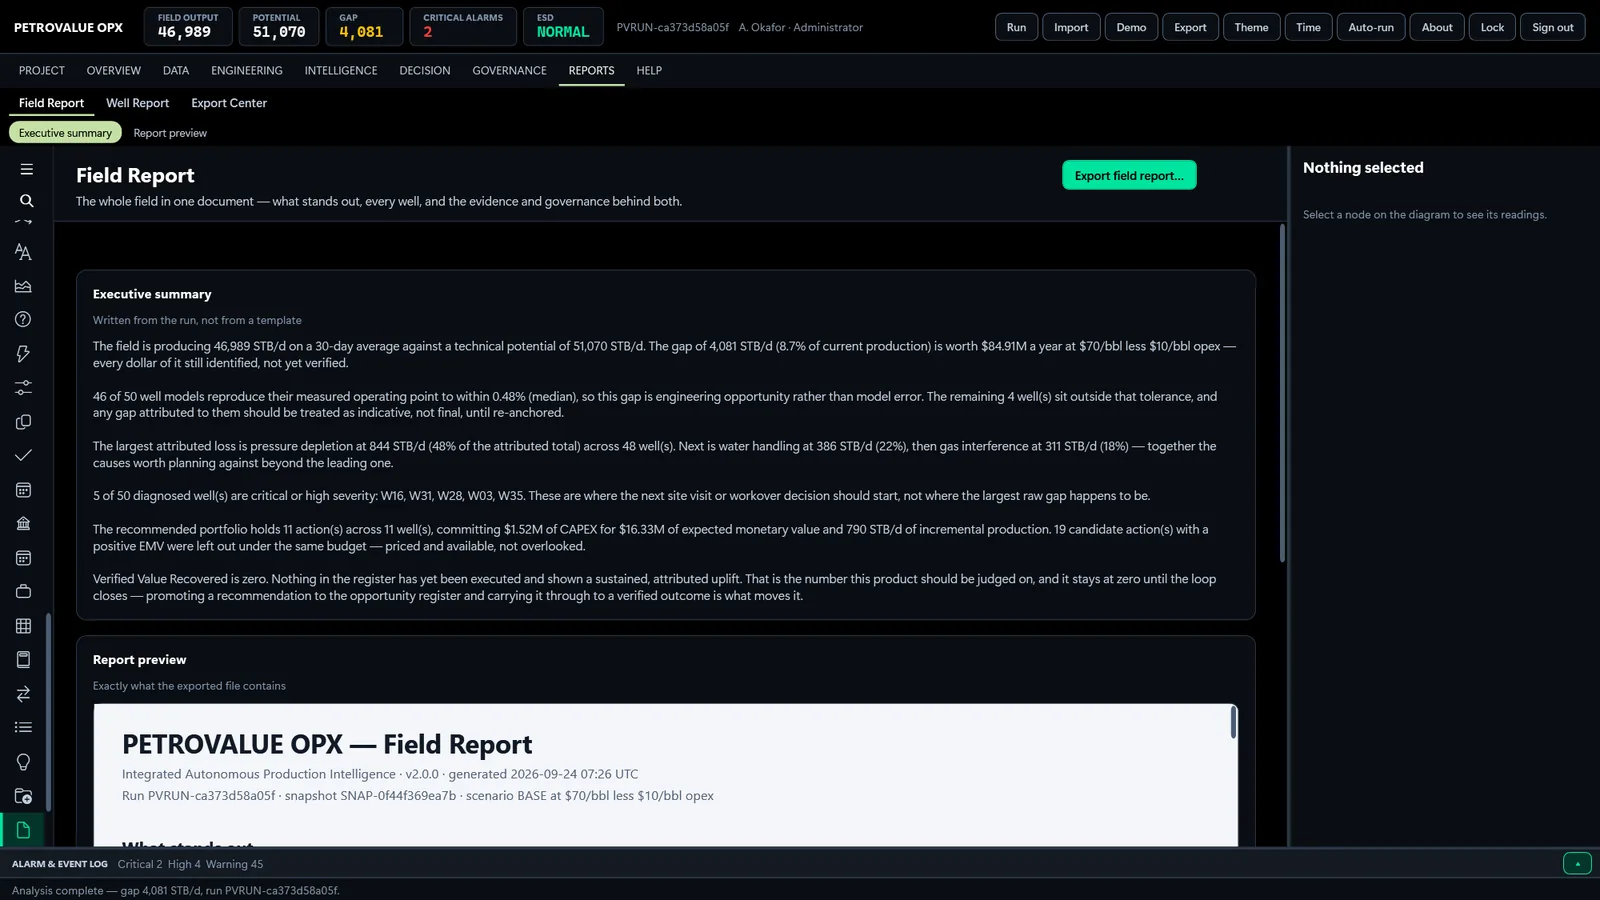
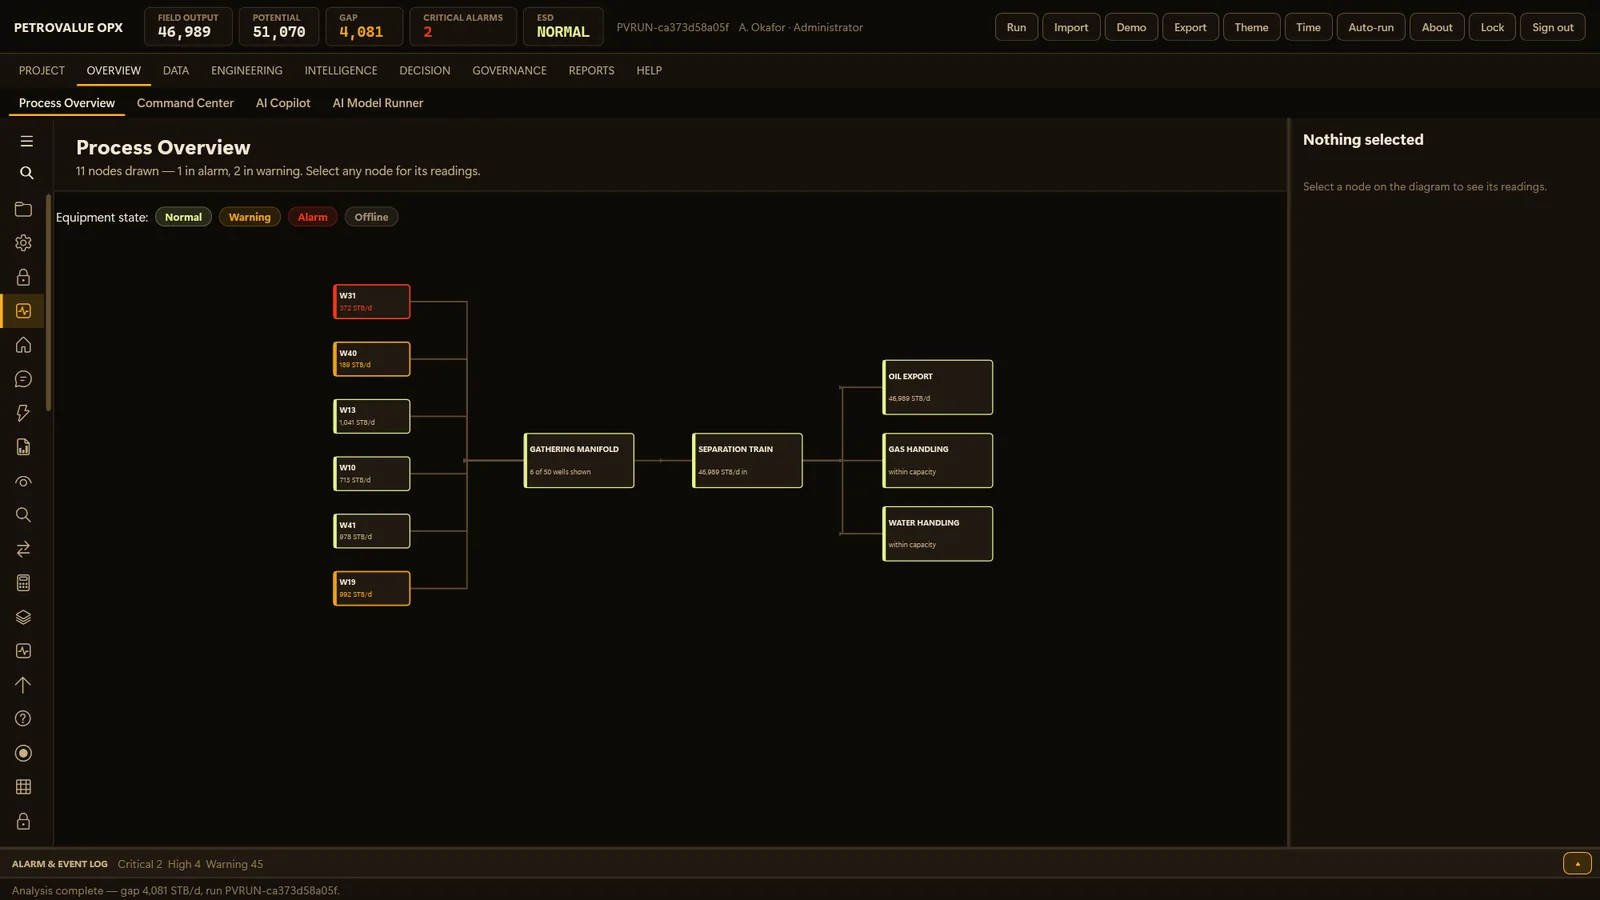
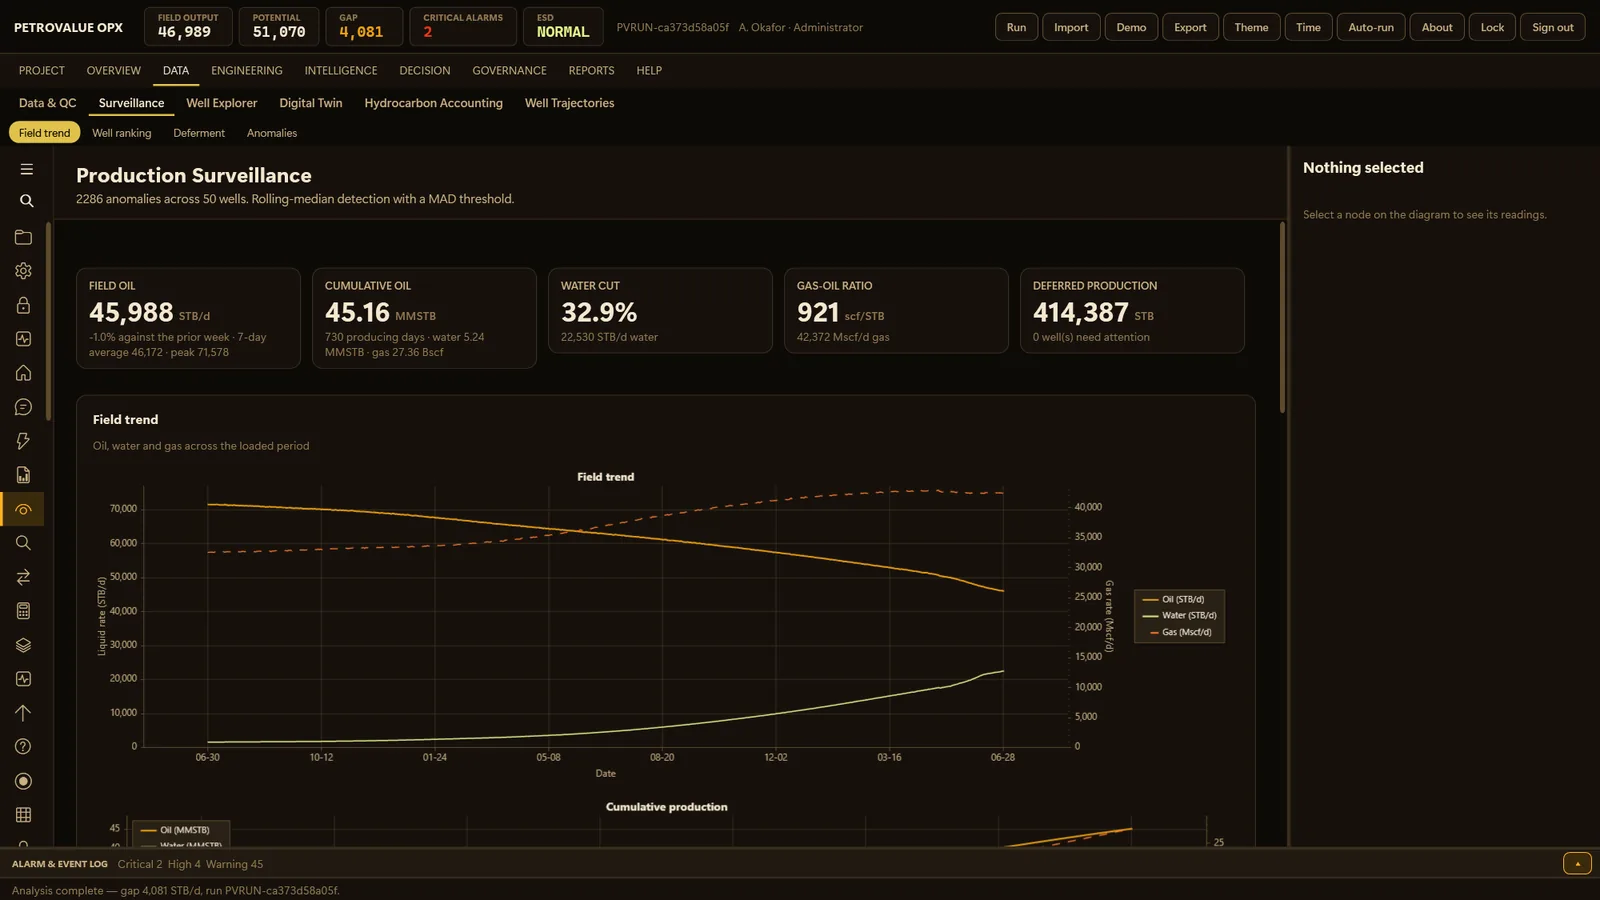
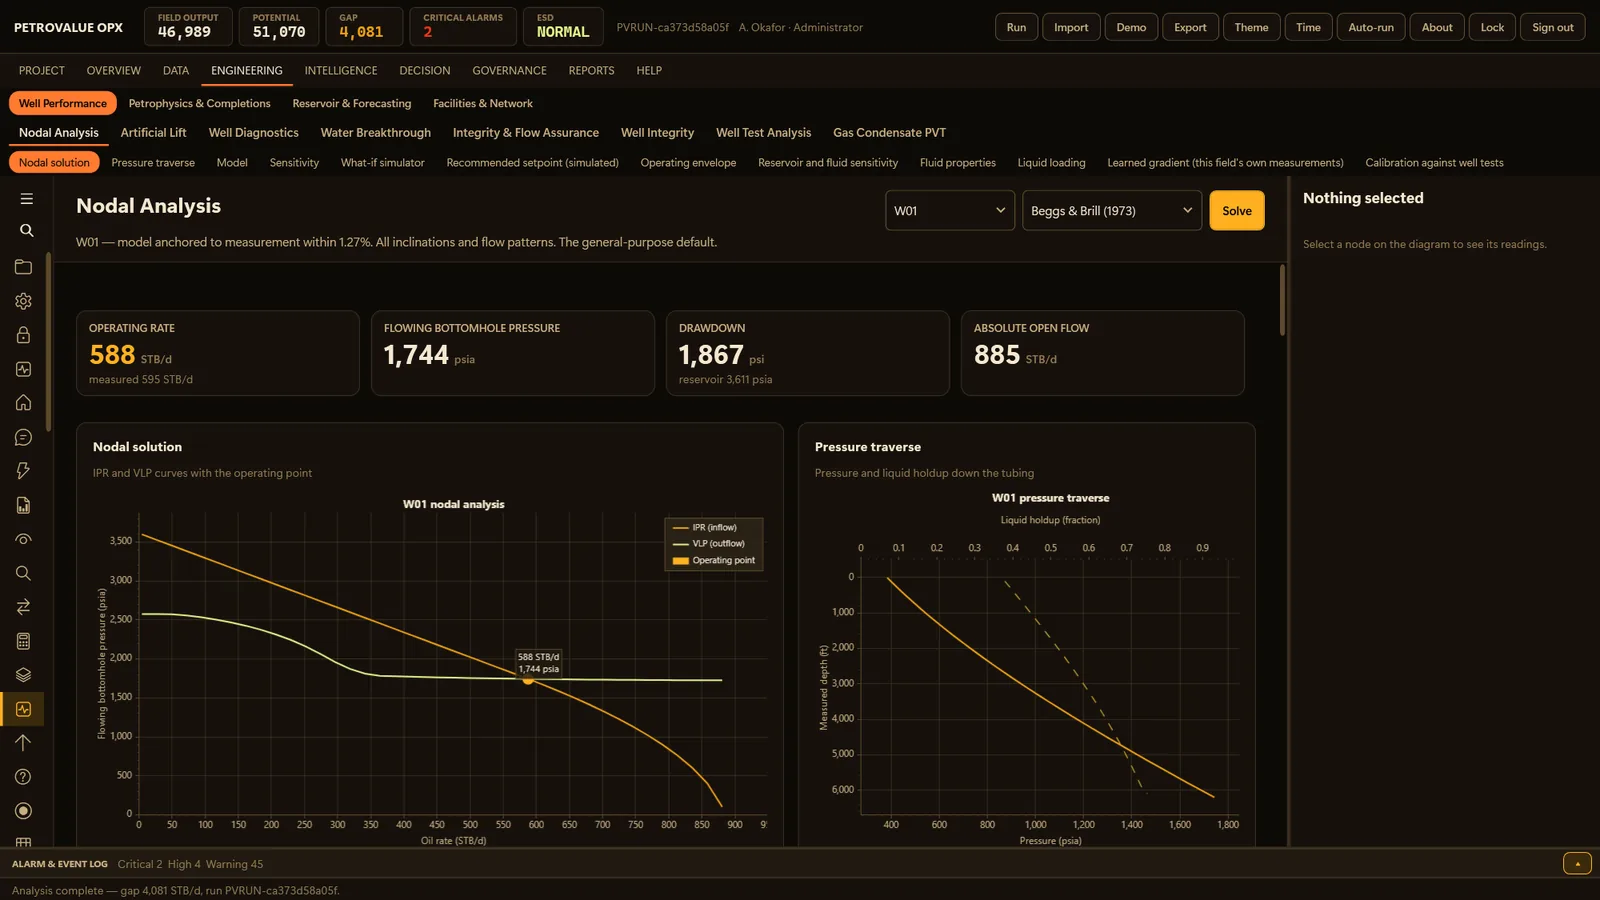
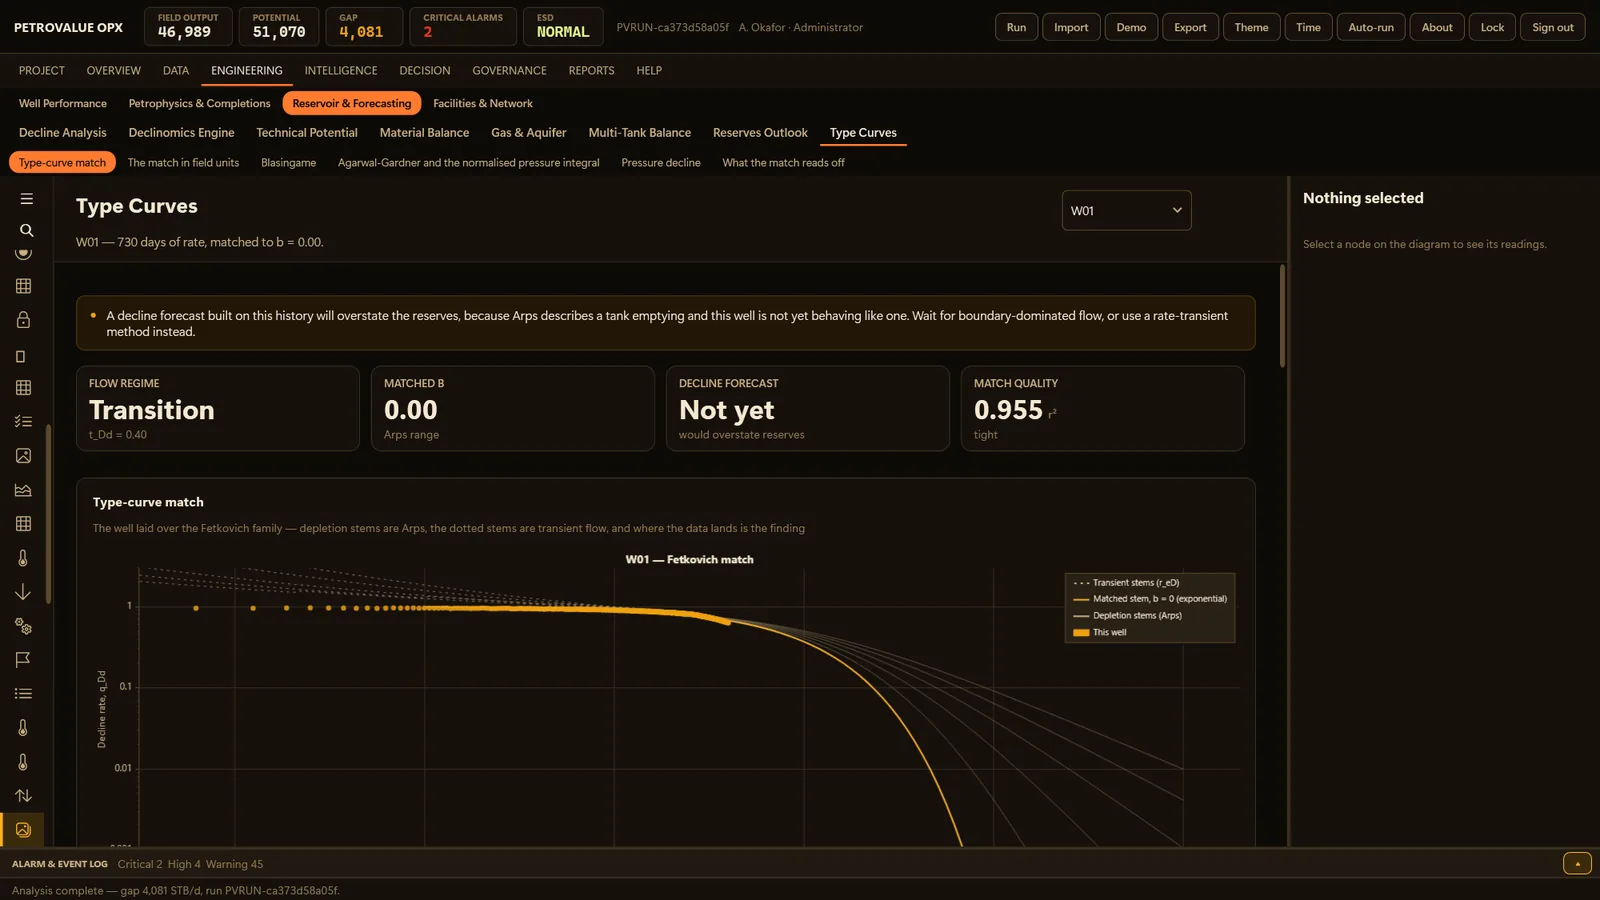
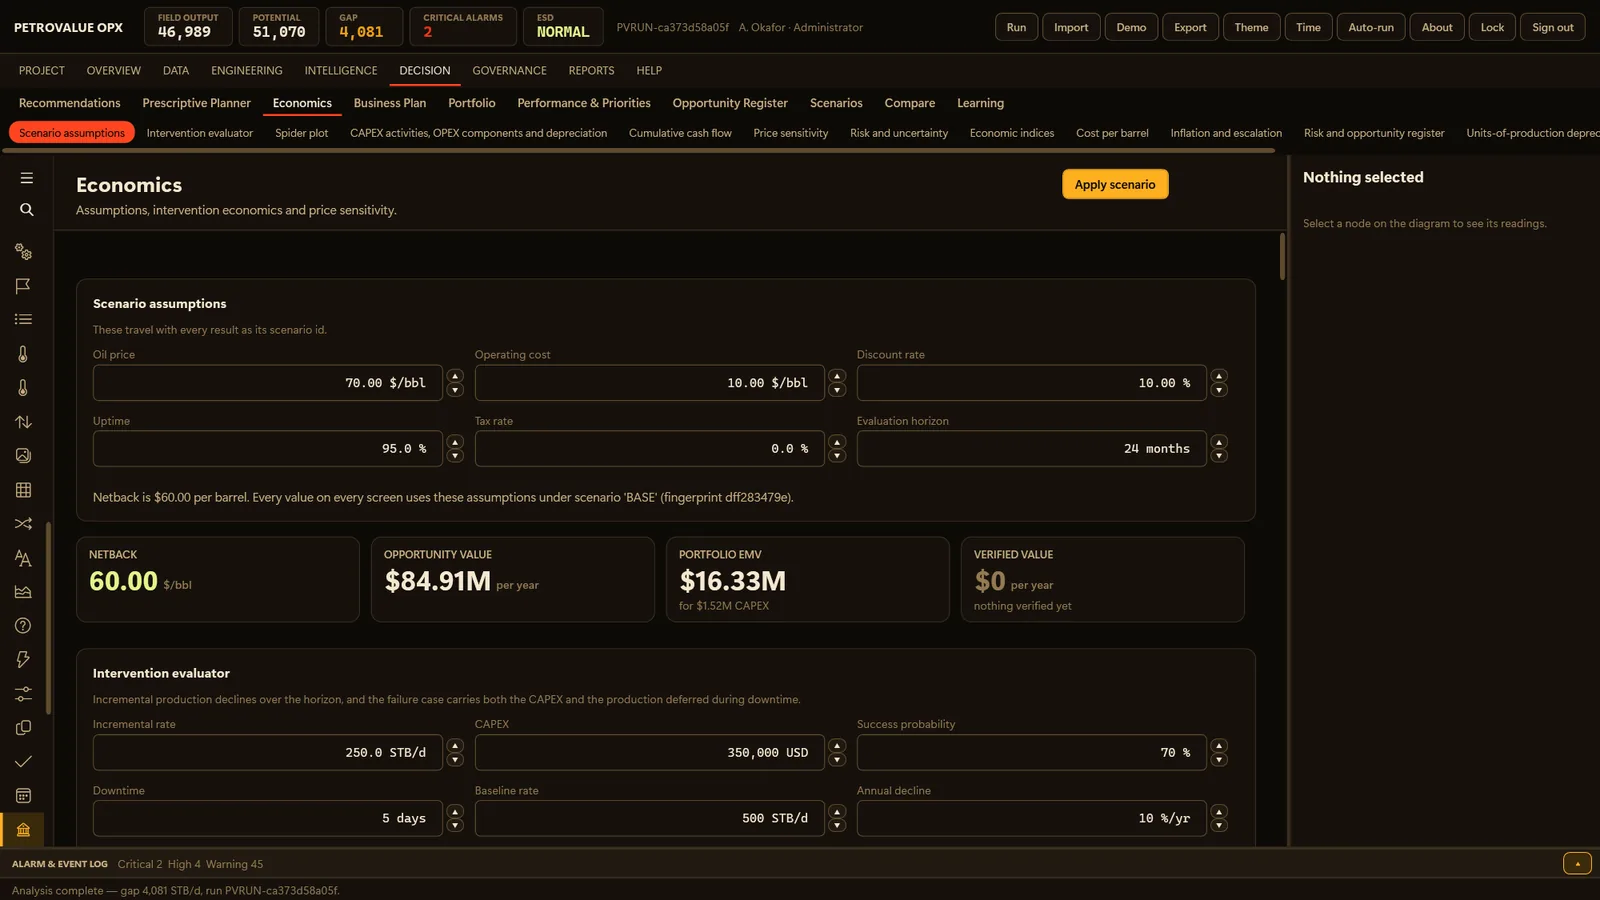
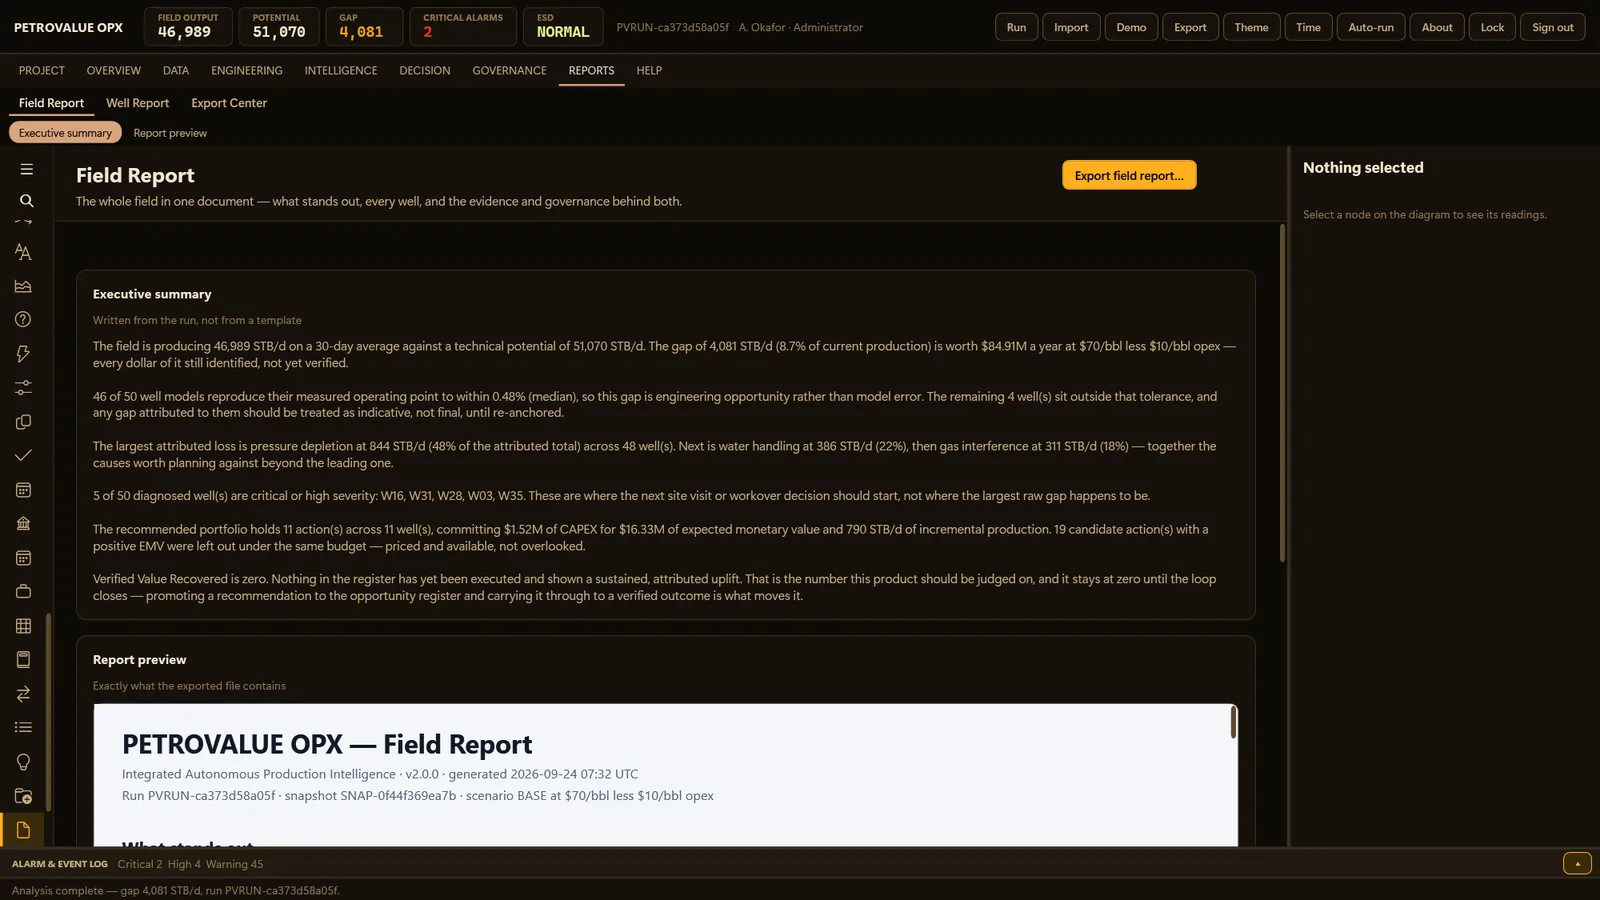
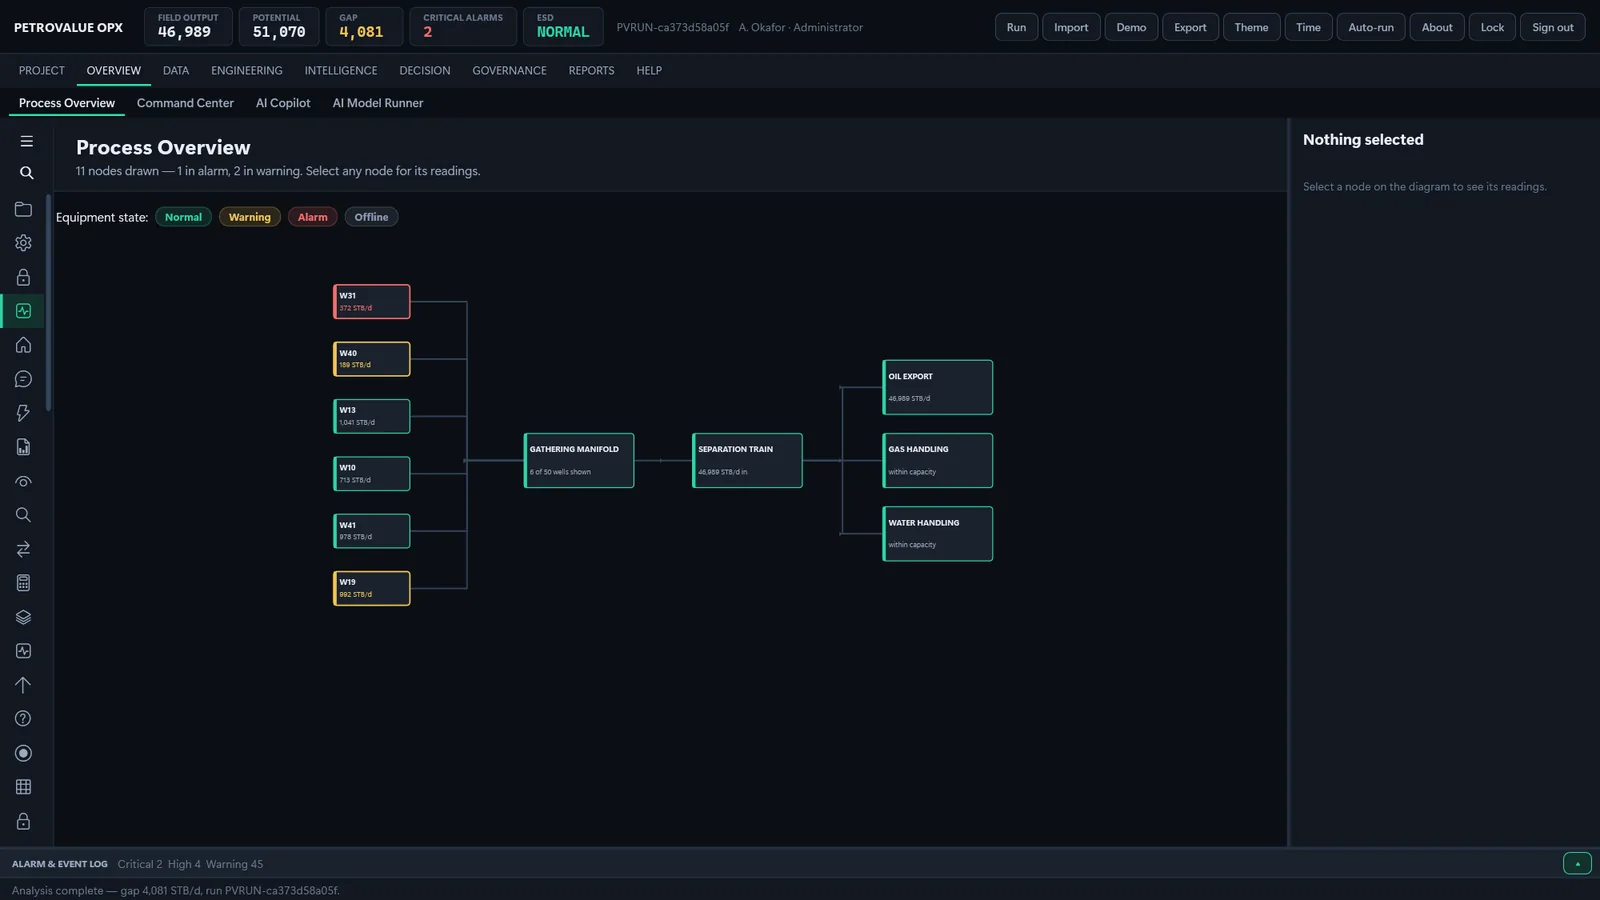
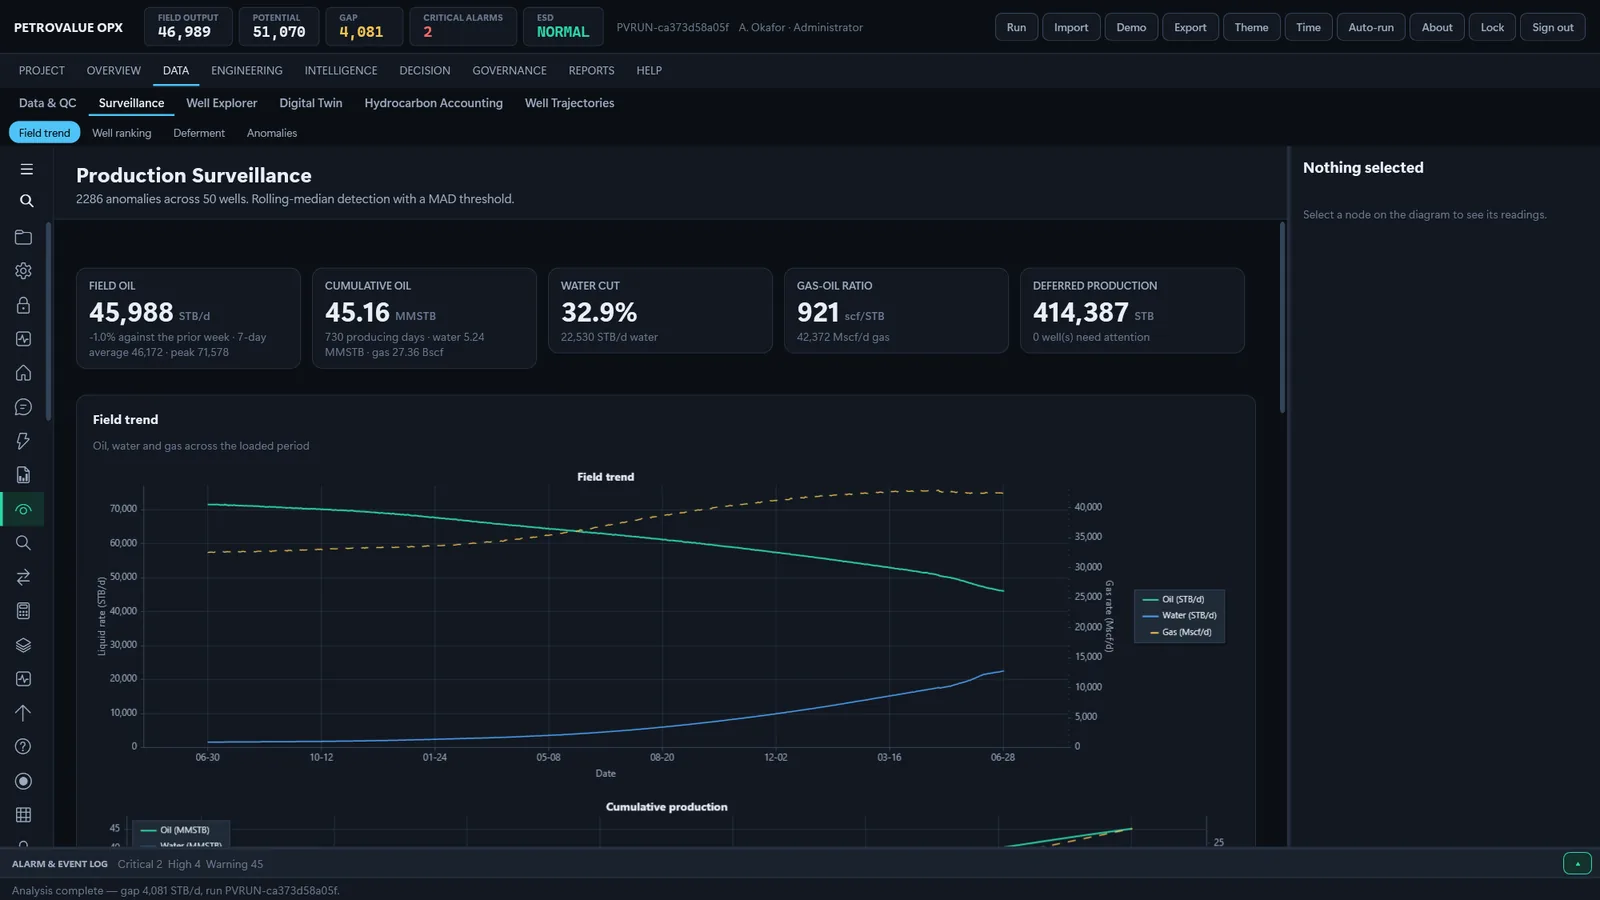
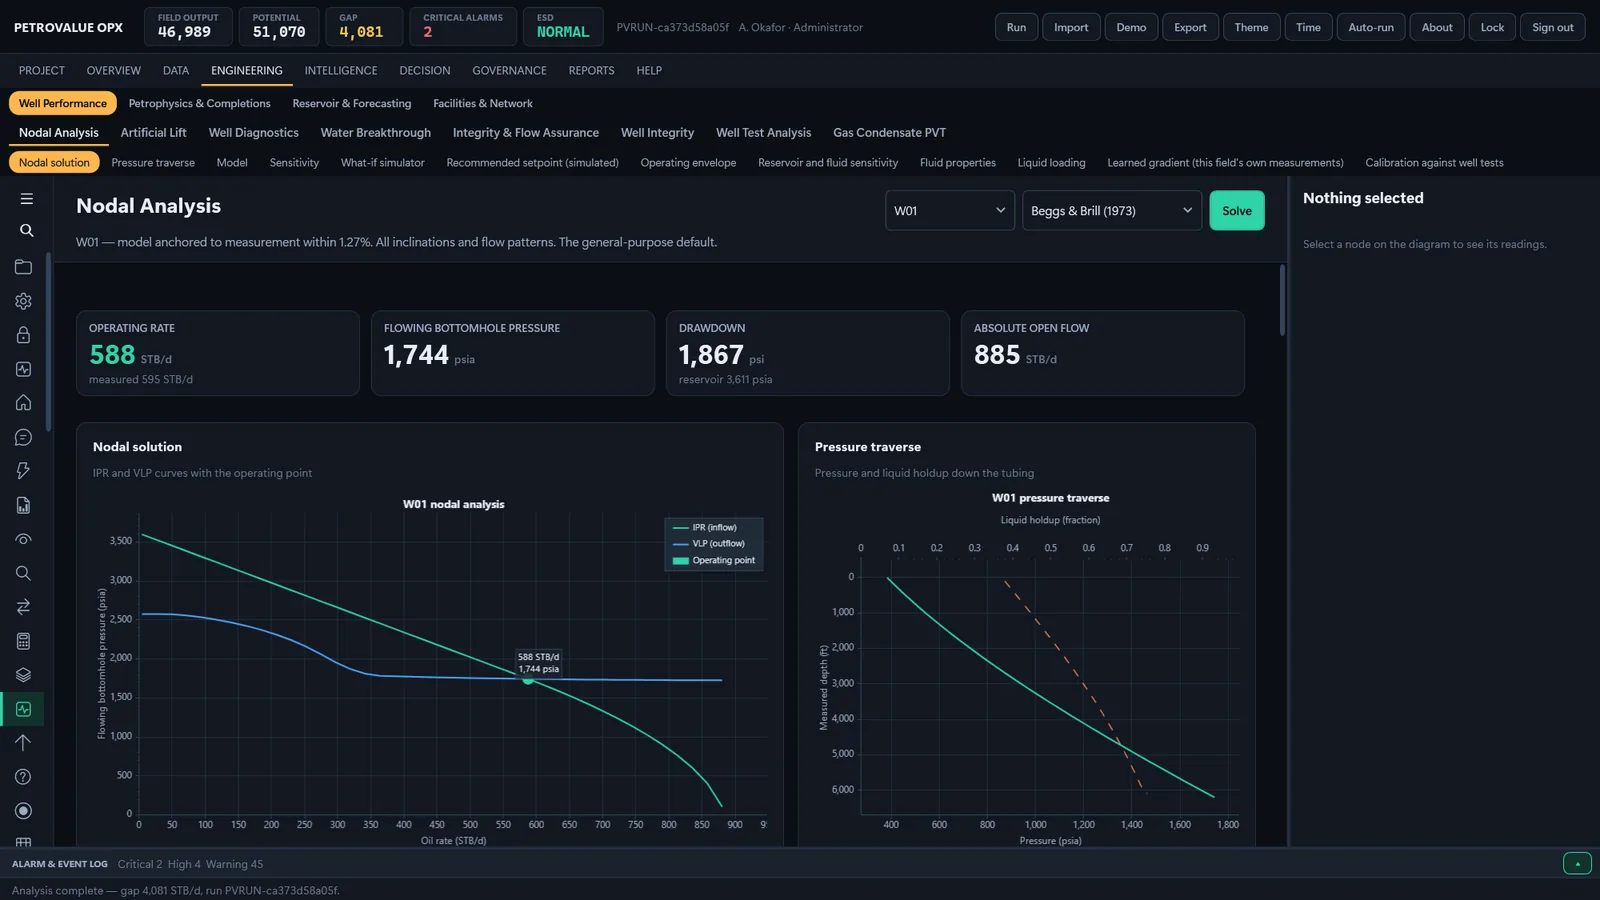
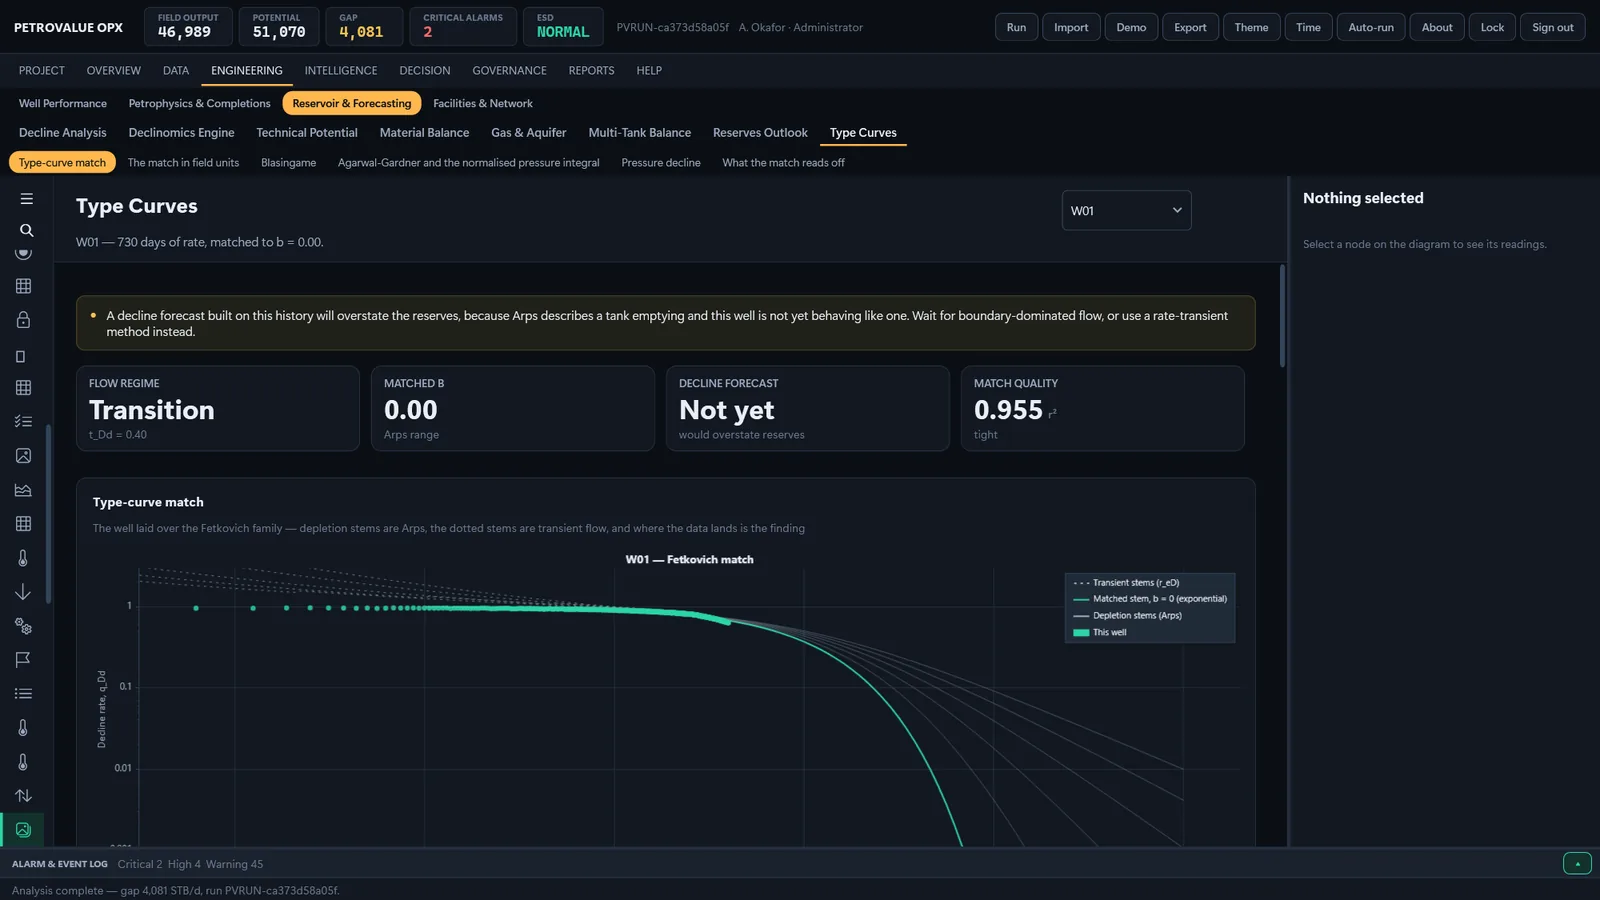
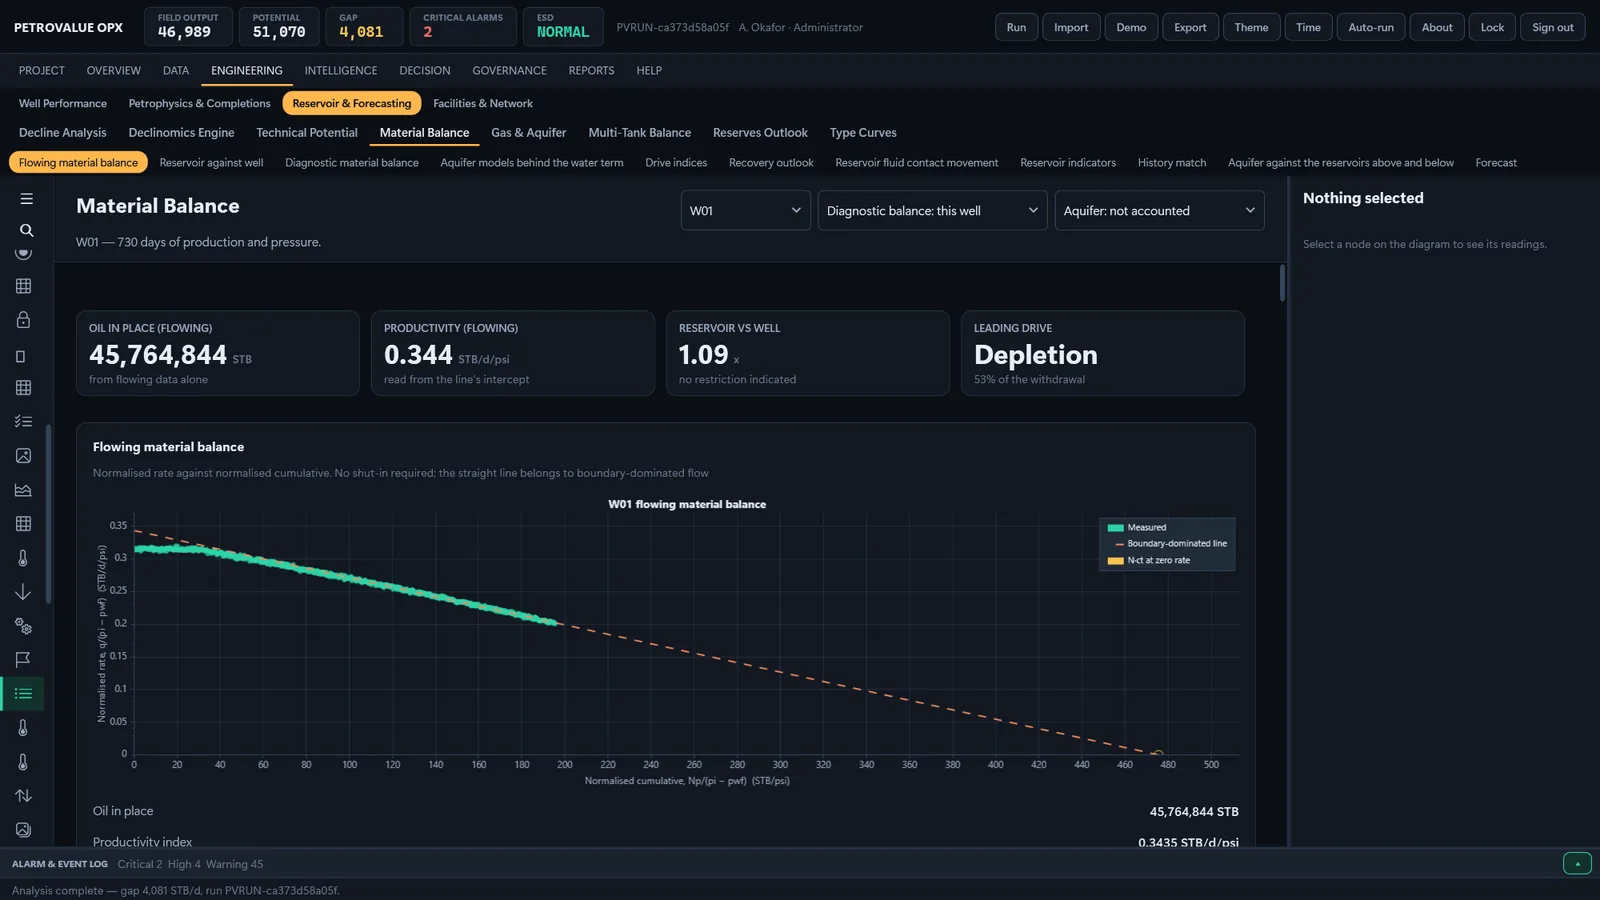
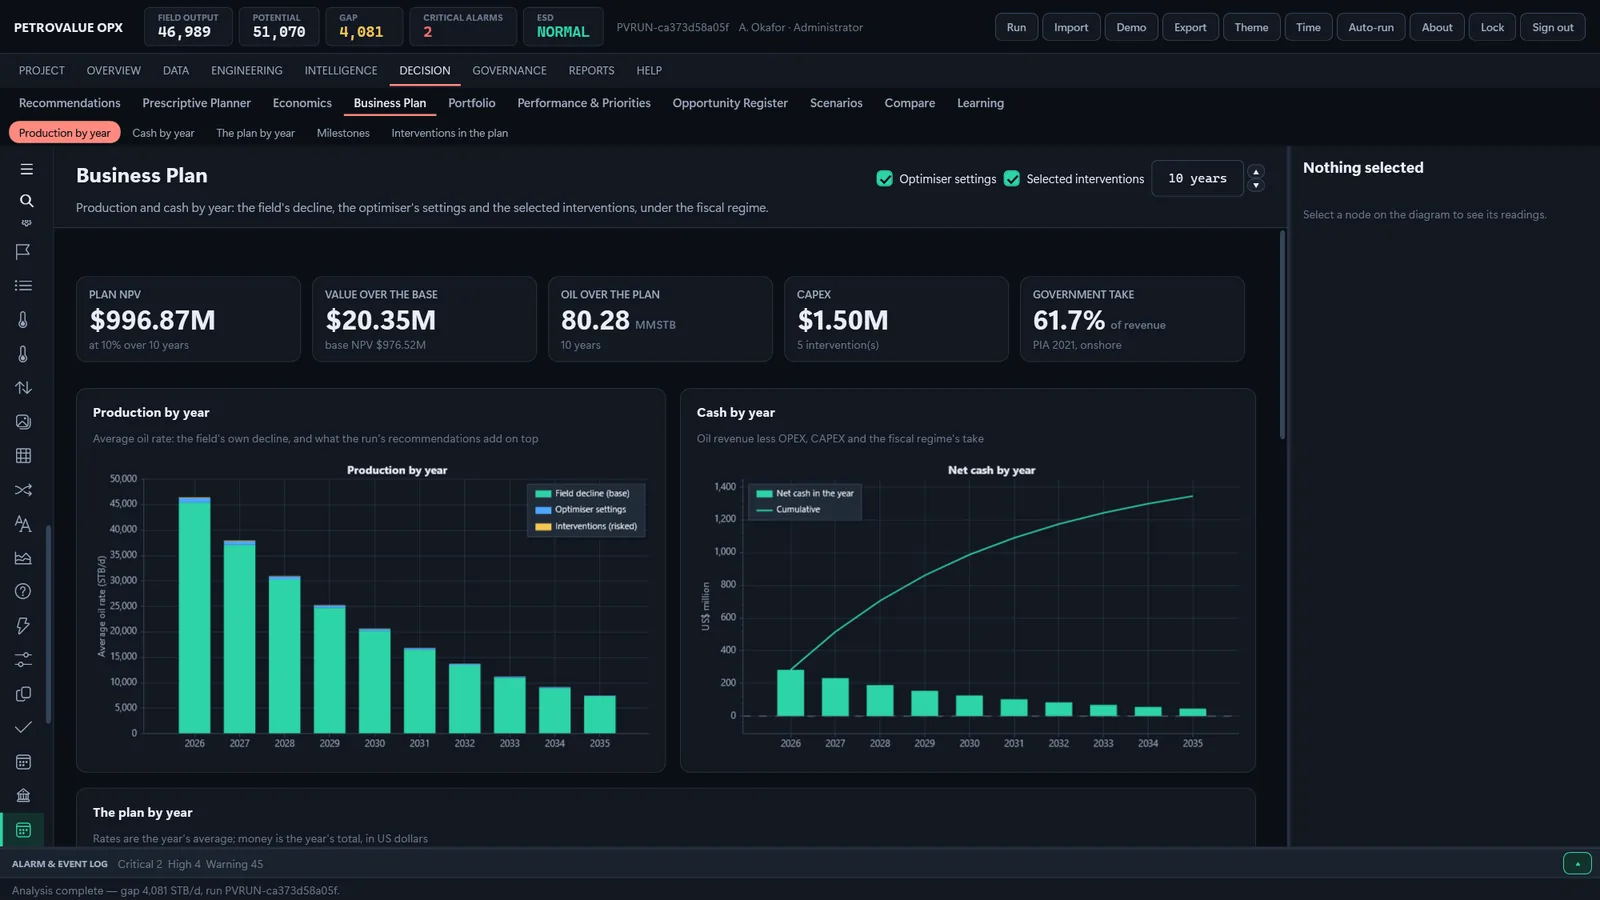
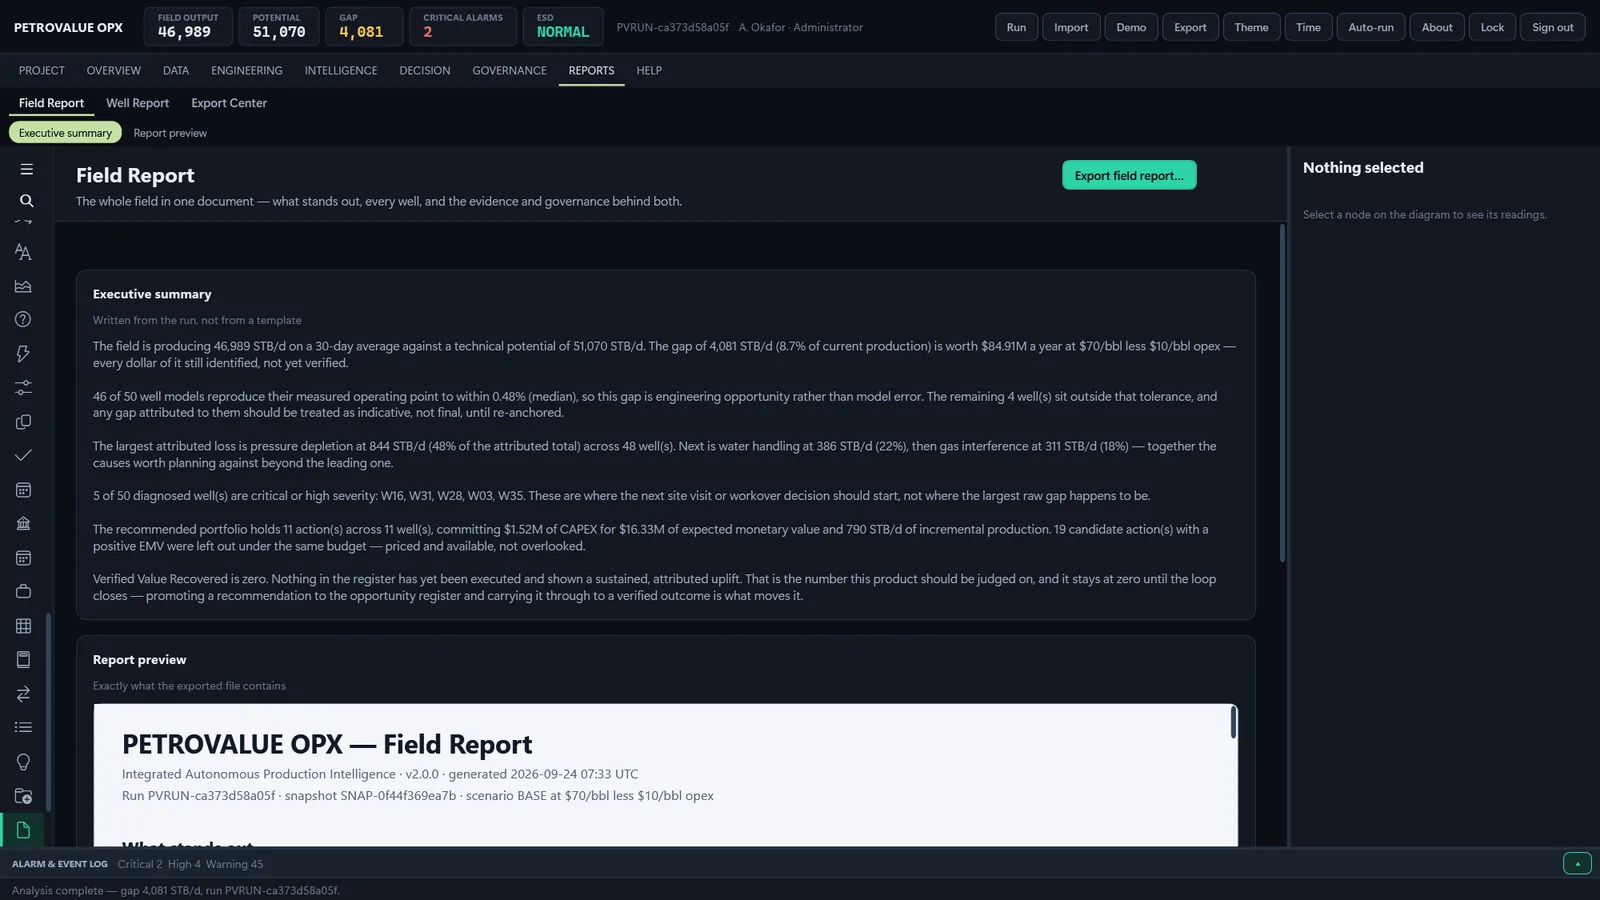
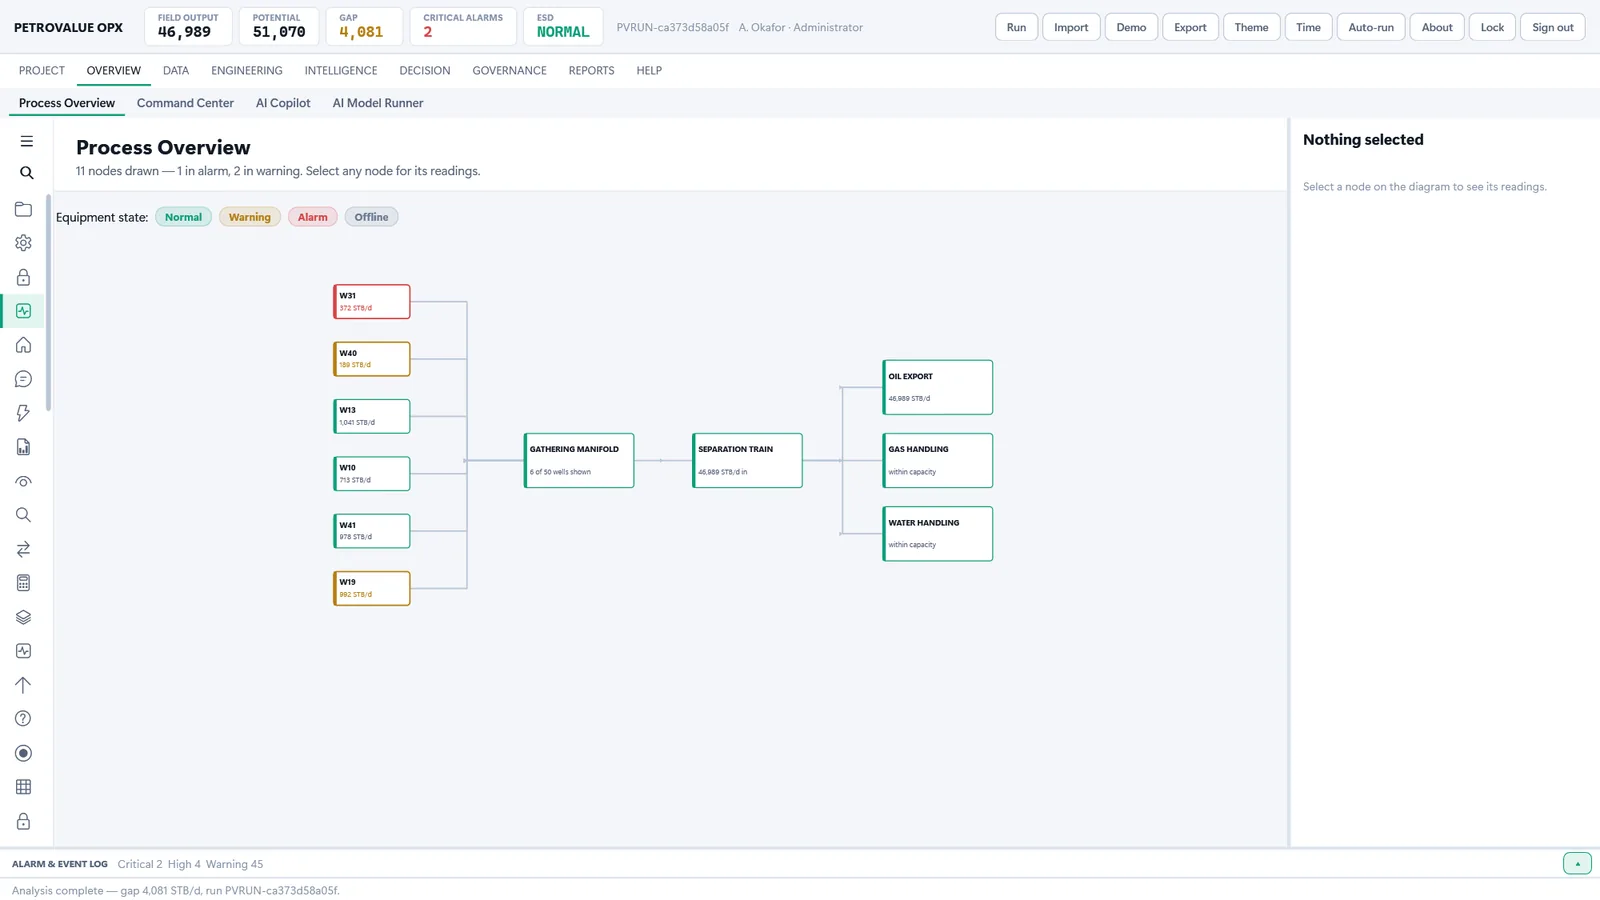
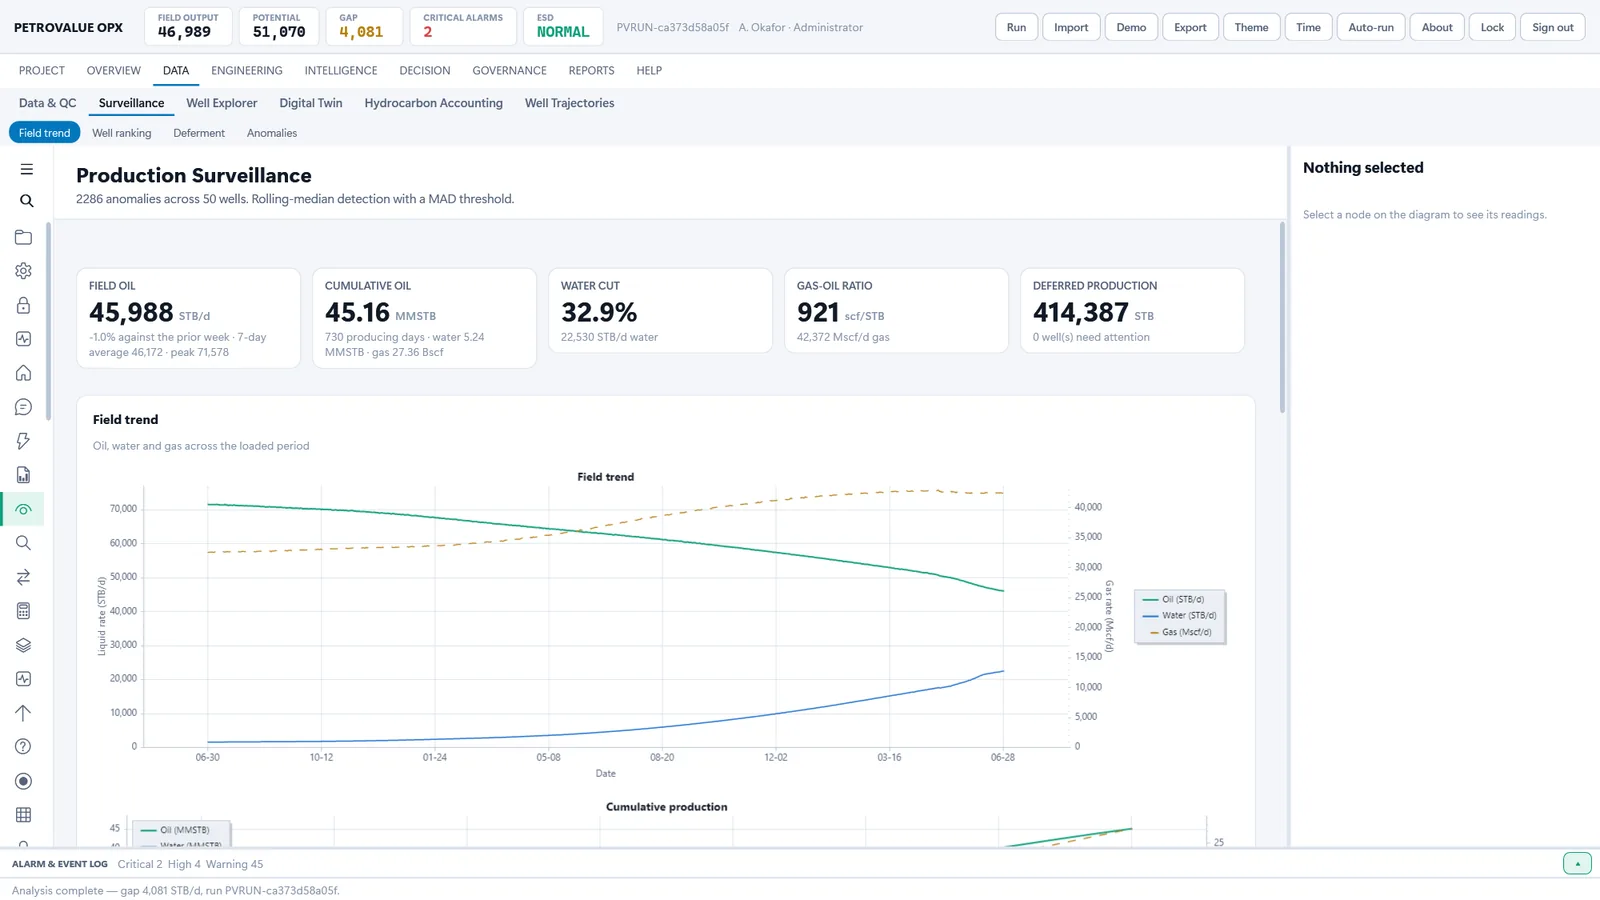
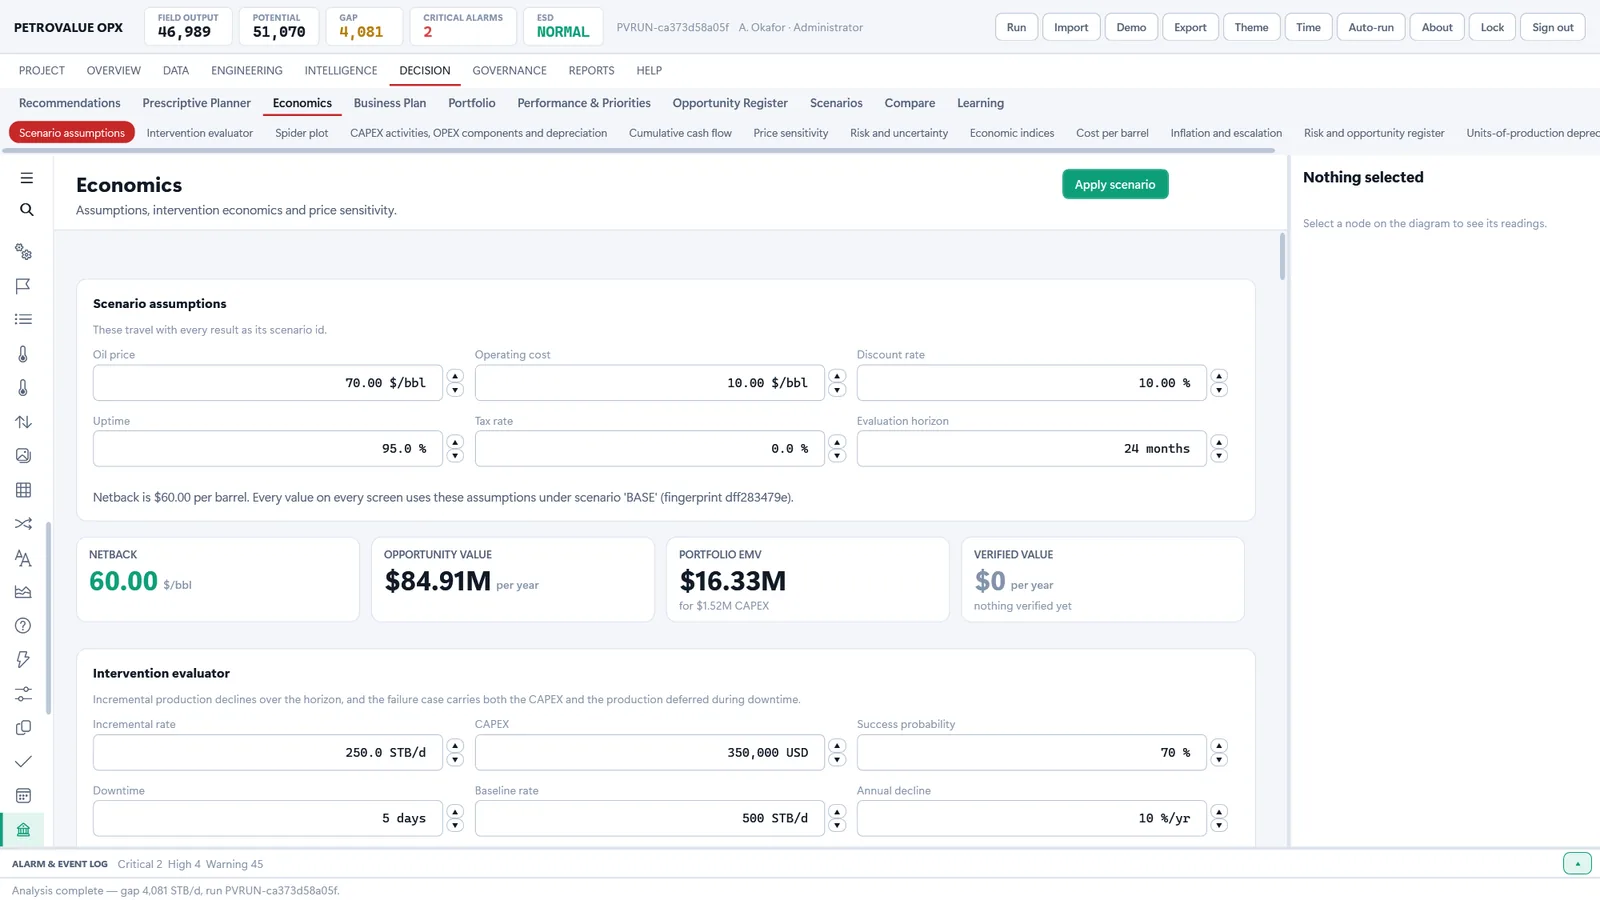
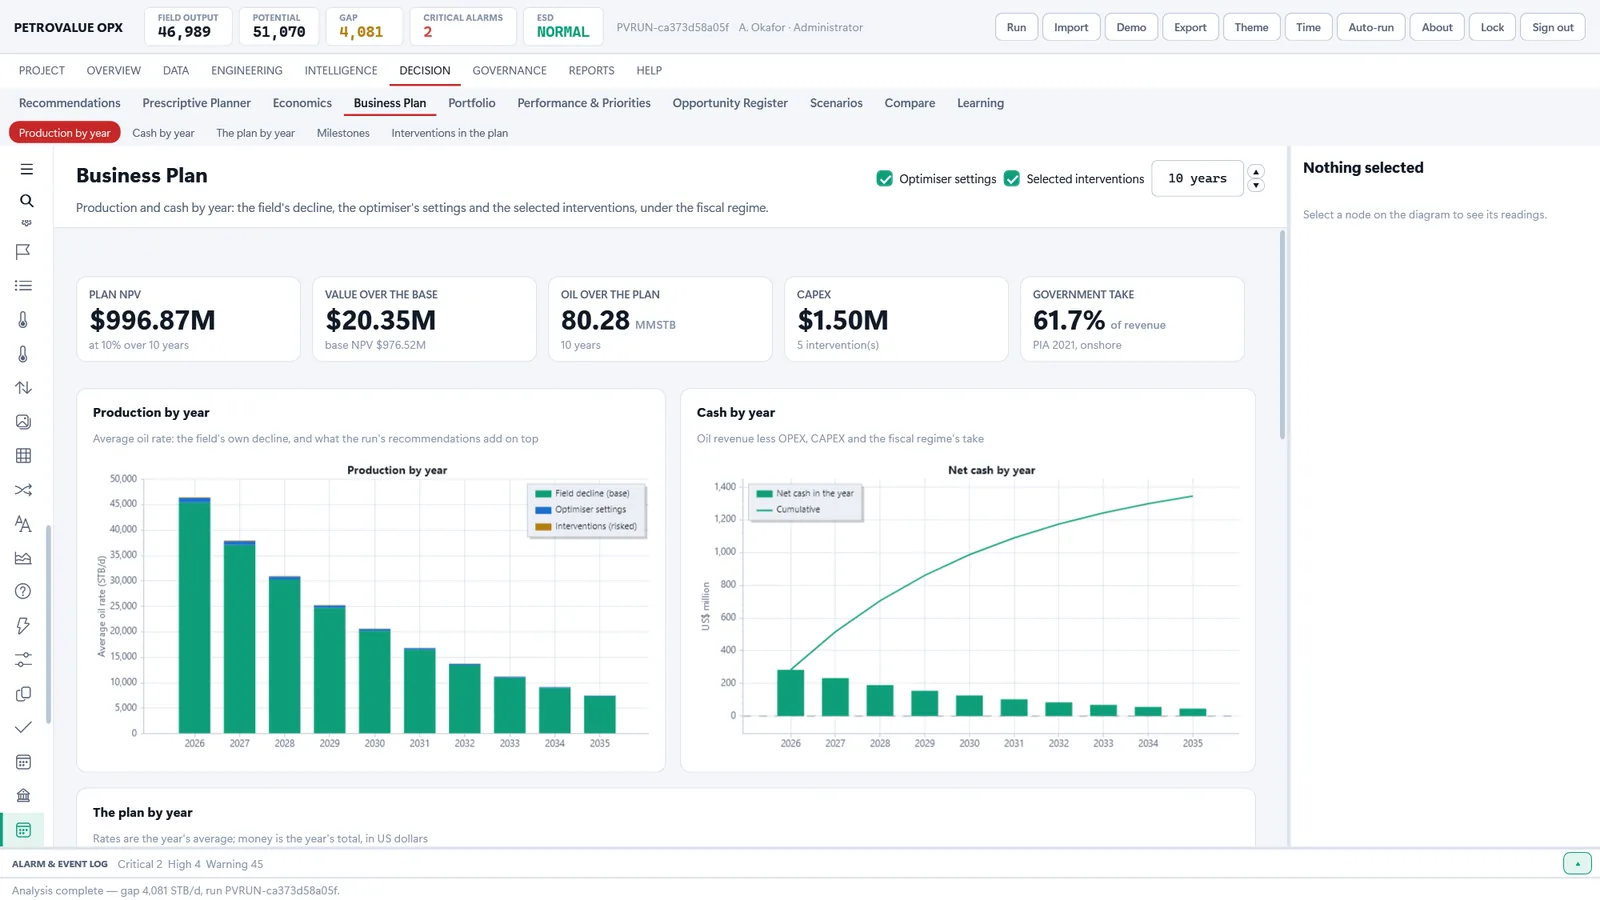
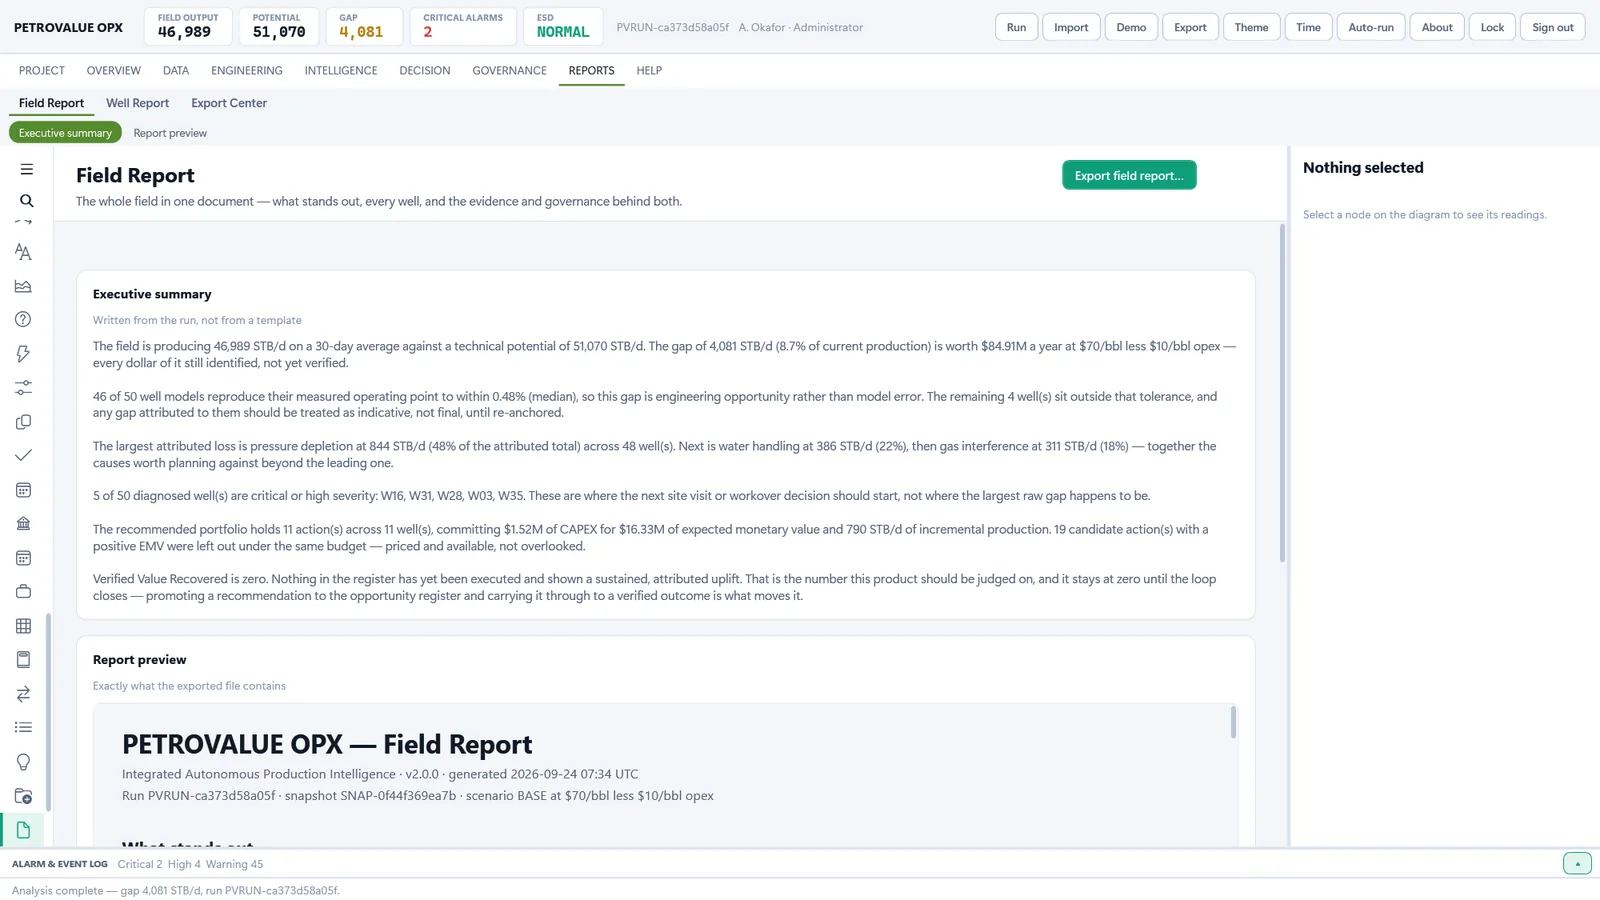
Charts, tables, badges, the process diagram and the alarm log all take their colours from the active palette. These follow the work in order — the field, then the well, the reservoir, the cause, the money and the report that leaves the building. The readings are identical in every row, so the only thing changing is the colour. Click any of them to enlarge.
Deployment
PETROVALUE OPX is a native Windows application. It installs like any enterprise desktop application, runs without an internet connection by default, and keeps your data on machines you control.
Import .DATA decks — WELSPECS, COMPDAT, PVT tables — with what was parsed reported back.
Drop a LAS file onto the page to view it as tracks alongside the well's history.
Export directional surveys as a deviation table Petrel reads directly.
An input template lists every column read; QC reports each mapping and remedy, and gates the run.
# verify the packaged build before you trust it
> PetroValue.exe --selftest --out report.txt
# headless field report, no display needed
> PetroValue.exe --report --data field.csv
# keep the application store on a shared drive
> PetroValue.exe --data-dir D:\pv-store
Why teams switch
| The usual way | With PETROVALUE | |
|---|---|---|
| Coverage | A sample of wells reviewed each quarter | Every well, every run: 1,000 wells and 730,000 daily records in about a minute |
| Models | Generic correlations that disagree with the meter | Each well anchored to its measured operating point first |
| Root cause | The first plausible explanation | Competing causes scored, and the test that would confirm each one |
| Priorities | Ranked by gut feel or value density | A portfolio solved against the budget, inside plant headroom and rig days |
| Economics | A separate model, rebuilt for every job | NPV, EMV, IRR and fiscal terms on the same run |
| AI | An assistant that writes an answer, with no way to check where a number came from | A copilot that only reports what a registered calculation returned, labelled with its evidence |
| Proof | Value claimed when the job is done | Value counted only after a sustained, verified uplift |
| Data | Uploaded to someone else's cloud | Stays on your machines, offline by default |
Walk the demo field with us, then load a sample of your own production data. Your data stays on your machines.
Pricing
Every plan runs the same engineering calculations. Plans differ in who uses the software and how it is deployed, not in which calculations you get. Annual licences in US dollars; Enterprise is priced to your assets and teams. Would you rather not run it yourself? We evaluate your field for you, per well.
For one production or reservoir engineer on their own workstation.
$50,000 per user / year
For an asset team that finds, approves and verifies interventions together.
$100,000 per year, up to 3 users
Everything in Engineer, plus:
For operators running several assets, or building PETROVALUE into their own workflows.
Contact us priced to your assets and teams
Everything in Asset Team, plus:
Or have us do it
No licence, no installation, no learning curve. Send us your production and static data and we run PETROVALUE over your field: every well anchored to its measured rate, the gap quantified, the causes diagnosed, the interventions ranked and costed under your fiscal terms.
$10,000 per well
Priced per well evaluated. Tell us how many wells and we will confirm the scope before any work starts.
Request an evaluationQuestions
No. It is decision support. It does not issue live well-control commands, and the what-if simulator writes nowhere. Approval and execution of any intervention require a named engineer with the right permission.
The copilot is an interface to the engineering calculations: it can only report what a registered calculation computed, labelled with its evidence type. The learning layer that does adapt scores executed interventions against their predictions and re-ranks future recommendations from your own field's results.
Daily production per well (oil, water, gas, pressures, choke) plus static tables for wells and reservoirs. Download the input template from the Data & QC workspace — it shows every column the application reads. Quality checks score the import and stop the run before economics if the data can't support it.
No, not by default. PETROVALUE runs offline on Windows. Voice input uses offline speech, and ONNX models run locally. It can optionally point at a SQL Server database for shared deployments. The one exception is the optional AI Agents workspace: it needs an internet connection and your own cloud account, and it sends your question and summaries of the analysis results — never the raw production records — to a cloud model. It does nothing until an administrator sets it up.
Not today. Those are proprietary formats without a public specification to verify a parser against. ECLIPSE .DATA decks and LAS logs are supported.
Economics applies fiscal regimes by terrain — including the Nigerian regime — and compares regime families. Price, operating cost, discount rate and uptime are held in an editable scenario.
By annual licence, in US dollars. Engineer is $50,000 per user per year. Asset Team is $100,000 per year for up to 3 users, with roles, the shared SQL Server register and an onboarding session. Enterprise, for several assets and teams, is priced to your deployment, so contact us. If you would rather not run the software yourself, our engineers evaluate your field for $10,000 per well. Every plan includes the full set of engineering calculations, so you never pay extra to unlock a calculation.
Request a demo below. Every installation ships with a physically generated 50-well demo field, so you can explore every workspace before loading your own data.
Request a demo
Tell us about your field. We'll walk through the demo field with your team, then help you load a sample of your own production data.